Introduction
The cost of nutritious food is an important determinant of food security, nutritional intake and, thus, health1. A number of sub-groups within the population have been identified as particularly vulnerable to food insecurity due to impaired physical access (from disability, lack of transport or geographical remoteness) or economic access (low socio-economic status) to supplies of healthy food2. In Australia, it is well established that food costs are much higher for people living in remote and very remote areas, and that due to reduced food variety and poor quality of fresh foods, people in these areas are at high risk of food insecurity3-7. Much less is known of food costs in urban and rural or regional areas. Recent work has shown that in urban Adelaide, South Australia, with a population size of just over one million8, healthy foods are readily available and food costs are lower in urban areas of low socio-economic status9. Another Australian study in a south-eastern urban local government area (LGA) of Melbourne, Victoria, suggests that lower socio-economic status areas have poorer access to healthy food10. The only published data on food cost and availability in rural and regional Victoria did not show a difference in cost when compared with Melbourne but identified that a complete healthy basket of foods was less likely to be available in the rural areas3.
The average Australian household spends 17% of their income on food11. For welfare recipients, however, this proportion is substantially higher. Data from surveys indicate that the cost of a healthy basket of food for a family of five reliant on government unemployment benefits accounts for approximately 30% of income7,9. Few data are available on the cost of a healthy diet for those sub-groups most vulnerable to food insecurity in Australia, particularly those living in regional areas.
Different tools have been used throughout Australia to measure the cost of a nutritious basket of food which, in turn, provides a factual basis from which to advocate for and support policy and practice in food security. The Victorian Healthy Food Basket (VHFB)12 is the most recent tool developed to measure food cost for people living in the state of Victoria in relation to family composition, food choices and food accessibility. It is the only Australian tool designed to meet the revised Nutrient Reference Values (NRV) for Australia and New Zealand13. The VHFB also uniquely calculates the cost of the basket of food for four different reference families with varying nutritional needs: (i) two adults and two children; (ii) a single mother with two children; (iii) a single adult male; and (iv) a single elderly female.
This study aimed to investigate the factors that influence cost of food in rural and regional Victoria. It also aimed to compare the cost of nutritious foods with more unhealthy foods, and to identify the relative cost of a healthy basket of foods for a range of different family types receiving government benefits.
Methods
A cross-sectional survey of the cost of food using the VHFB was conducted in a selection of 34 supermarkets in rural and regional areas across Victoria between October and November 2007. The VHFB consists of 44 core and non-core foods, selected according to the Australian Guide to Healthy Eating14, plus two extra foods, a soft drink (Coca Cola; Amatil, Sydney, NSW) and chocolate bar (Mars Bar; Masterfoods Ballarat, Victoria), selected to allow a price comparison between healthy and unhealthy foods. The basket was designed to meet the nutritional requirements (based on current NRV13), for a fortnight for four different family types: (i) 'typical family' (44 year old male and female, 18 year old female, 8 year old male); (ii) 'single parent family' (44 year old female, 18 year old female, 8 year old male); (iii) 'elderly pensioner' (71 year old female); and (iv) 'single adult' (adult male >31 years). The cost of the basket was then compared with the fortnightly government unemployment benefits received by each different family type. This income was determined using government Centrelink data from January 2008 (Centrelink, pers. comm., January 2008) and with the assumption that no family members were employed: typical family, $1,000.52; single parent family, $741.80; elderly pensioner, $512.10; and single adult, $420.90. Development of the VHFB was modelled on other Australian healthy food basket surveys and has been described elsewhere12.
The VHFB data were collected on a standardised collection sheet with accompanying detailed instructions. Data collection was carried out by students enrolled in the third year of the Monash University Bachelor of Nutrition and Dietetics (BND) while they were on a rural placement from October to November 2007. Stores were a convenience sample because all stores present in the towns where the BND students had been sent on placement (Bairnsdale, Ballarat, Beechworth, Bendigo, Colac, Hamilton, Horsham, Portland, Sale, Swan Hill, Traralgon, Warrnambool, Wodonga) were selected. All stores that were located in the town of the placement were selected unless they supplied less than 90% of the items in the basket, in which case they were excluded. Permission to conduct the survey was obtained by students from the store manager on the day of the survey. Ethics approval was not required to access this public data.
Prices of the cheapest, non-generic brands were recorded in the specified package size. If the specified size was not available, the price of the next smaller size was recorded and quantities adjusted accordingly. No discounted or special prices were recorded.
For each town surveyed, remoteness was determined by use of the Accessibility/Remoteness Index for Australia (ARIA)15. Socioeconomic status was assessed using the Socio-Economic Indices for Areas (SEIFA) 200116, while population size and density and distance of each town from state capital Melbourne were taken from Victorian Government statistics17.
Data were analysed using SPSS v15.0 for Windows (SPSS Inc; Chicago, IL, USA). The distribution of data, assessed by the Kolmogorov-Smirnov test, was non-normal. Aggregate data are therefore described by the median (interquartile range [IQR]). Comparisons among groups were made with the Mann Whitney U-test, while differences in proportion were established by the χ2 test. Relationships between the cost of the VHFB and indices of remoteness (ARIA) and socioeconomic advantage (SEIFA) as well as population density, distance from Melbourne and population size were assessed using Spearman's rank order correlation. Variation in the cost of food groups has been calculated as (interquartile [range/median]*100). Significance was taken as p<0.05.
Results
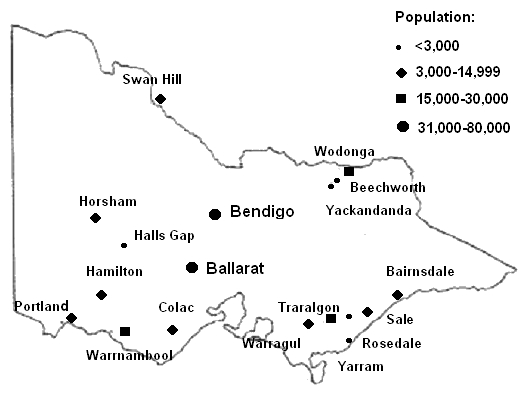
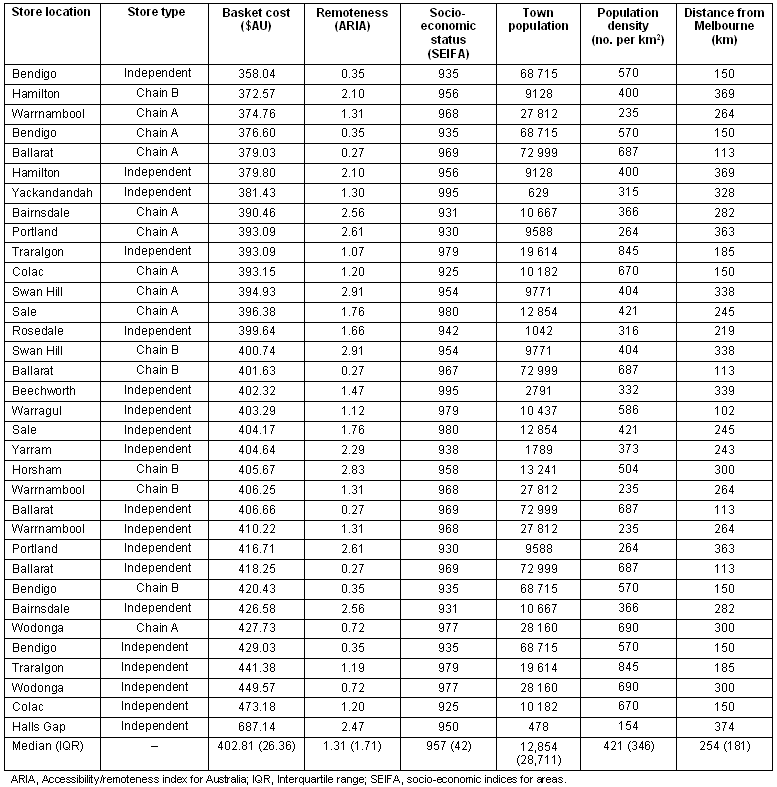
Thirty-four different stores across 18 towns in 14 Victorian LGAs (Fig1) were surveyed, ranging in size from 478 to 72 999 persons, with a median of 12 854 persons (Table 1). The ARIA scores ranged only from 0.27 to 2.83. In total, towns included covered 29% of Victorian rural and regional LGAs. While 40% of the 20 largest Victorian rural and regional towns (population size above 10 000) were included, less than 5% of the smaller rural and regional towns have been included. Fifteen of the 18 towns (exceptions were Yackandandah, Beechworth and Hall's Gap) were located on a main highway. Stores at which the cost of a VHFB was collected were either from a chain supermarket (chain A or chain B), were small independent supermarkets from a range of different companies (eg 'Foodworks', 'IGA') or were independently owned (56% of total) (Table 1).

Figure 1: Map of Victoria, Australia, indicating towns where the Victorian Healthy Food Basket was collected.
Table 1: Cost of the Victorian Healthy Food Basket for a 'typical family' (2 adults, 2 children) for a fortnight, in a convenience sample of 34 non-metropolitan stores surveyed across Victoria. Aggregate data are the median (interquartile range).

The median cost (IQR) of the VHFB for the typical family was $402.81 ($26.36). Basket cost varied by $329 from $687 per basket at the most expensive store (Hall's Gap, independent) to $358 at the least expensive store (Bendigo, independent) (Table 1). The cost of the VHFB was not significantly related to remoteness by ARIA (rho = -0.079), socioeconomic status by SEIFA (rho -0.005), distance from Melbourne (rho = -0.049) or population density (rho = 0.0164).
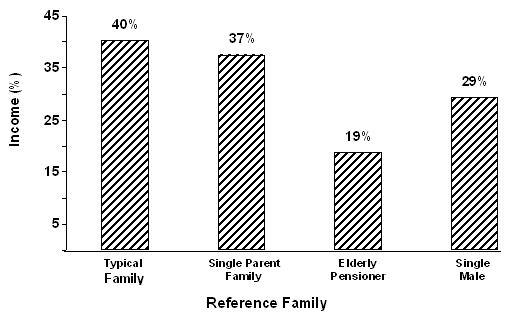
The median cost of the VHFB for a typical family did not differ significantly when purchased at a supermarket from chain A versus chain B (p = 0.41). If, however, the basket was purchased at an independent store, the cost was significantly higher (median cost $406.66 [$29.39] versus $394.93 [$26.64], for an independent store purchase and a supermarket purchase, respectively, p = 0.024). Figure 2 indicates the cost of a VHFB relative to income. Both an elderly pensioner (19%) and a single male (29%) would spend a significantly lower proportion of their welfare income on the purchase of a basket than would a four person typical family (40%; p<0.001 and p<0.05, respectively).
Table 2 indicates the median cost for different food components of the VHFB, with the cost of vegetables and legumes contributing the greatest proportion of the total cost of the basket, and unhealthy foods contributing the least. The cereal group was inexpensive but contributed one-third of the total energy content and 22% of the total protein content of the basket. The non-core food items were also inexpensive but contributed no protein and only 7% of total energy. Vegetables and legumes showed the greatest variation in price, significantly greater than price variation for cereals (p<0.05), non-core foods (p<0.05) and unhealthy foods (p<0.001).

Figure 2: Median percentage of unemployment benefit income spent by reference families on the Victorian Healthy Food Basket when purchased at 34 non-metropolitan outlets in Victoria.
Table 2. Variation in cost for a 'typical family' of food groups in the Victorian Healthy Food Basket, purchased across 34 Victorian stores

Discussion
The results of this study provide additional insight into food costs across rural and regional Victoria, and illustrate that healthy food may be unaffordable for some sub-groups in the Victorian population. While work has been undertaken to assess food costs across much of rural and remote Australia4-6, there has been little examination on the factors that influence food cost in a population-dense state such as Victoria. The present findings are consistent with a previous study undertaken in rural Victoria on food cost, which found substantial variation in the cost of the same basket of food across the state, and that the basket was less expensive when purchased in larger chain supermarkets rather than in smaller independent stores3. While difference in cost with store type may reflect greater store buying power, as reported previously9, there remains much unexplained variation in food cost.
The present study aimed to identify factors that might influence variation in food costs. No association between remoteness (as represented by ARIA) or distance from Melbourne and food cost was identified in Victoria. This differs from northern areas of Australia, where food costs in remote and very remote areas have been consistently shown to be more expensive4,6. This difference may be explained by the relative ease of access of most Victorian towns to major road or rail services, as reflected in the limited variation in ARIA scores (0.27-2.83). In contrast, in northern areas of Australia very remote locations may have an ARIA score as high as 12.015. In addition, no association was evident in Victoria between SEIFA and food cost. This again differs from studies conducted in the metropolitan areas of Adelaide and Melbourne, where strong relationships were observed between socio-economic status and access to healthy food9,10. This may be due to the small sample size and the limited range of SEIFA in the sample. There is a need for further studies to examine a larger and more diverse SEIFA sample to measure whether there is a true association between SEIFA and food cost.
Analysis of the cost of different food components of the VHFB indicated the high absolute cost and higher variation in the cost of healthy foods compared with unhealthy food items. Energy-dense, nutrient poor or unhealthy foods have also been shown to be less expensive in other countries18. The variation in the cost of fruit and vegetables in the present study is of concern for food and nutrition security but is somewhat understandable from the transport distance and perishable nature of these food stuffs.
The present study provides a picture of the cost of food for different Victorian family types that are most vulnerable to food insecurity. Taking into consideration indispensable household expenses, it has been proposed that food account for a maximum of 30% of income in order to remain affordable19. Other studies have shown that an unemployed family spends approximately 30% of their welfare income on food7,9, which is higher than that of the average Australian (17%)11. The data from this study indicate that a single parent family and single adult male may need to spend up to 40% of their income to consume a nutritionally adequate diet. This is an important finding because unemployed single men and single mothers have been identified elsewhere as being most vulnerable to food insecurity2. The single elderly female pensioner's expenditure on healthy food is in line with the estimated average income expenditure on food, providing evidence that single pensioners in Victoria have good economic food access. However, other work has reported the physical food insecurity issues (mobility issues, disability, illness or transport difficulty) for this group that still leaves them vulnerable to food insecurity2. Food is only one of the essential items for families. Rent, transport, services and health care are other basic needs known to be given priority to food in budget spending20.
This study has several limitations. The convenience sample does not adequately represent all rural towns in Victoria. While 40% of larger population towns were included in the survey, there was an inadequate sample of smaller towns17. The VHFB records the price of the most inexpensive brand of product. Using non-generic products means the basket is not the cheapest available but ensures quality and reliability of the tool. If generic brands were chosen, it is anticipated that the total cost of the basket may have been reduced, providing a different picture of the cost of food relative to income. The basket is based on a limited food culture and does not take into account the diverse food cultures that exist in Victoria.
These data build on work already undertaken to show the importance of the affordability of a nutritious diet in order to improve health. It also highlights the need for a national system to monitor healthy food prices to improve consistency and relevance among states and territories, and to take into account the increasingly multicultural food choices. The development and use of a national basket for monitoring food prices has clear benefit by providing important data for governments to assist in planning and addressing food insecurity and nutrition related disease19,21. This glimpse into food costs across rural and regional Victoria illustrates an unexplained variation in food costs across areas, and further supports the notion that healthy food may be unaffordable for population sub-groups in Victoria.
Conclusions
This study investigated the cost of the VHFB across 34 different stores in rural and regional Victoria. With the exception of one significant outlier, there was limited variation in the cost of the basket among stores. There was no association between food cost, ARIA, SEIFA, population density, distance from Melbourne or population size; however, the basket cost was significantly cheaper in large chain stores. Healthy food items had greater variation in cost across the stores compared with the unhealthy foods, and much of this variation remains unexplained. The cost of the basket appears to be most expensive and potentially unaffordable for a typical and single-parent family, and for a single man. This study demonstrated the ability of the VHFB to assess economic food security for different population sub-groups, and highlights the need for a national healthy food basket that better reflects recent food consumption patterns. This would provide national data from which to support the development of food and nutrition policies and improve access to healthy food. This, in turn, would create environments that support healthy food choices and improve population health.
Acknowledgements
The authors acknowledge the year 3 Monash University Bachelor of Nutrition and Dietetics students of 2007 for their work in collecting the data, and the Victorian Department of Human Services Health Promotion and Chronic Disease Prevention team for their advice on relevant analysis.
References
1. World Health Organisation. Diet, nutrition and the prevention of chronic disease: a report of a joint WHO/FAO expert consultation. Geneva: WHO, 2003.
2. Booth S, Smith A. Food Security and poverty in Australia - challenges for dietitians. Australian Journal of Nutrition and Dietetics 2001; 53(3): 150-156.
3. Burns C, Gibbon P, Boak R, Baudinette S, Dunbar J. Food cost and availability in a rural setting in Australia. Rural and Remote Health 4: 311. (Online) 2004. Available: www.rrh.org.au (Accessed 19 November 2008).
4. Lee A for Queensland Health. The 2001 Healthy Food Access Basket (HFAB) Survey. (Online) 2003. Available: http://www.health.qld.gov.au/ph/documents/hpu/33125.pdf (Accessed 26 November 2008).
5. Meedeniya J, Smith A, Carter P. Food Supply in Rural South Australia: a survey on food cost, quality and variety. Eat Well SA. (Online) 2000. Available: http://www.publications.health.sa.gov.au/cgi/viewcontent.cgi?article=1001&context=food (Accessed 26 November 2008).
6. Price R, Ethical Nutrition Services. NT Nutritionist's Market Basket Survey. (Online) 2002. Available: http://members.ozemail.com.au/~dietinfo/mbs.htm (Accessed 1 November 2006).
7. Williams PG, Reid M, Shaw K. The Illawarra Healthy Food Price Index. 2. Pricing methods and index trends from 2000-2003. Nutrition and Dietetics 2004; 61(4): 208-214.
8. Australian Bureau of Statistics. Census of population and housing. Available: http://www.abs.gov.au/websitedbs/d3310114.nsf/Home/census (accessed January 2008).
9. Tsang A, Ndung'u MW, Coveney J, O'Dwyer L. Adelaide Healthy Food Basket: A survey on food cost, availability and affordability in five local government areas in metropolitan Adelaide, South Australia. Nutrition and Dietetics 2007; 64(4): 241-247.
10. Burns CM, Inglis AD. Measuring food access in Melbourne: access to healthy and fast foods by car, bus and foot in an urban municipality in Melbourne. Health & Place 2007; 13: 877-885.
11. Australian Bureau of Statistics. Household Expenditure Survey. (Online) 2005. Available: http://www.ausstats.abs.gov.au/ausstats/subscriber.nsf/0/6D5F1DDFF4729C60CA25705900755727/$File/65300_2003-04.pdf (Accessed 19 February 2008).
12. Palermo C, Wilson A. Development of a healthy food basket for Victoria. Australian and New Zealand Journal of Public Health 2007; 31(4): 360-363.
13. National Health and Medical Research Council. Nutrient reference values for Australia and New Zealand including recommended dietary intakes. (Online) 2005. Available: http://www.nhmrc.gov.au/publications/synopses/_files/n35.pdf (Accessed 26 November 2008).
14. Department of Health and Ageing. Australian Guide to Healthy Eating. (Online) 2001. Available: http://www.health.gov.au/internet/main/publishing.nsf/Content/E384CFA588B74377CA256F190004059B/$File/fd-cons.pdf (Accessed 26 November 2008).
15. Australian Government, Department of Health and Aging. Measuring remoteness: Accessibility/Remoteness Index of Australia (ARIA), revised edn. Occasional Papers: New Series no 14. Appendix F: Aria Values for 1999 Statistical Local Areas. Update 21 August 2007. Available: http://www.health.gov.au/internet/main/publishing.nsf/Content/ECF75BE371332ADACA25733E000FA70E/$File/ocpanew14f.pdf (Accessed 26 November 2008).
16. Australian Bureau of Statistics. Socio-Economic Indexes for Areas (SEIFA). (Online) 2006. Available: http://www.abs.gov.au/AUSSTATS/abs@.nsf/DetailsPage/2033.0.55.0012006%20(Preliminary)?OpenDocument (Accessed 1 March 2008).
17. Victorian Government. Department of Sustainability and Environment. (Online) 2006. Available: http://services.land.vic.gov.au/knowyourarea/homepage.html (Accessed 1 August 2008).
18. Monsivais P, Drewnowski A. The rising cost of low energy dense foods. Journal of the American Dietetic Association 2007; 107(12): 2071-2076.
19. Burns C, Friel S. It's time to determine the cost of a healthy diet in Australia. Australian and New Zealand Journal of Public Health 2007; 31(4): 363-365.
20. Crowley S. Affordability of a healthy diet for low income families: re-addressing the issues. Australian Journal of Nutrition and Dietetics 1997; 54(4): 165-166.
21. Seal J. Monitoring the price and availability of healthy food - time for a national approach? Nutrition and Dietetics 2004; 61(4): 197-198.
Abstract
Introduction: The cost of healthy food has been associated previously with the degree of remoteness and socioeconomic status. This study aimed to investigate the factors that influence the cost of food in rural Victoria, Australia. It also aimed to compare the cost of nutritious foods with less healthy foods, and to identify the population sub-groups most vulnerable to economic food insecurity.
Methods: A cross-sectional survey of the cost of food was undertaken in 2007 in a convenience sample of 34 supermarkets in rural areas across Victoria using the Victorian Healthy Food Basket (VHFB). The VHFB was designed to meet the nutritional needs of four different family types for a fortnight.
Results: The cost of the VHFB for a 'typical family' (2 adults, 2 children) was (mean [interquartile range]) $AU402.81 ($26.36). No association was evident between food cost and remoteness as indicated by the Accessibility/Remoteness Index for Australia (ARIA) score, socioeconomic status as indicated by the Socio-Economic Indices for Areas (SEIFA), population size or density, or distance of the town from the state capital, Melbourne. It was more expensive to purchase the VHFB at an independent store (median cost $406.66 [$29.39]) than at a supermarket chain (median cost $394.93 [$26.64]), p<0.05. Vegetables and legumes were the most expensive component of the VHFB to purchase and this food group showed significantly greater variation in food price than cereals (p<0.05), non-core foods (p<0.05) and unhealthy foods (p<0.001). The median cost of the VHFB was most expensive for a typical family and 'single parent family' (40% and 37% of welfare income) and least expensive for a single man (29% of income) and elderly pensioner (19% income).
Conclusions: The VHFB is an effective tool for assessing economic food security for different population groups. The cost of food in rural Victoria varies in a manner that appears unrelated to remoteness, population, socioeconomic status or distance from the metropolitan centre. Purchase of healthy food requires a considerable proportion of welfare income and may thus be unaffordable for some groups. Food cost must be monitored at a national level to provide a knowledge base to inform development of food and nutrition policies for improved population health.
Key words: Australia, healthy foods basket, rural food cost, Victoria.


