Australia is the sixth largest country (in area) in the world with a total area of over 7.5 million km2 (3 million miles2)1. Most Australians live clustered on the coastal fringes of the continent with nearly 90% of the population of 21 million living in major cities or inner regional areas. The remaining 10% are scattered over vast areas with most living in outer regional areas and less than 2.5% in remote or very remote areas2.
Dentistry in Australia has and continues to face significant workforce issues, in particular a shortage of practitioners and a grossly distorted dental workforce distribution. To date much of the research and policy activity in dental workforce planning and development has been based on simple statistical analysis, including practitioner-to-population ratios3. These ratios are used extensively by government think-tanks to promulgate arguments for and against increased workforce development and the driving of various funding allocation agendas4-6. Most of Australia's largest states have a ratio of approximately 50 dentists per 100 000 people.
Australia is not alone in resting on this ratio as a driver of discussions and the ratio is regularly cited in the international public dental health literature7-9. Australia is a unique blend of high wealth (high development) and poverty with arguably one of the most uneven population distributions in the world. This, coupled with vast distances (eg two state capitals are more than 3700 km apart), makes it essential to clearly develop and use measures pertinent to the socio-geographic landscape.
This study examined the application of dental practice-to-population (PtP) ratios as a yardstick for dental workforce measures. The study examined two states of Australia (as a model) to clarify the underlying meaning of the ratio and to test its applicability in the unique socio-geographic environment of a highly irregularly distributed population over a massive land mass.
All population data were obtained from the most recently available Australian Census of Population and Housing (2006; from the Australian Bureau of Statistics website) and divided by collection districts10. Collection districts are the smallest unit for collection of the data. Also collected from the website were collection districts and suburb boundary files in shapefile format (the universally accepted format for geographic data files).
The physical addresses for every private dental practice in two states of Australia, namely Western Australia (WA) and New South Wales (NSW), were collated from a number of open sources including the Government Gazette and the relevant registration board websites. The two states were chosen because they were either largest in population (NSW) or in area (WA). The addresses were cross-checked against the Yellow Pages telephone directory as at June 2009 (WA) and June 2011 (NSW), in keeping with previous studies by this team11. All addresses were entered into a database and the longitude and latitude of each practice address were obtained using a free access geo-coding website (https://maps.google.com.au/maps). A randomly selected sample of 5% of all geo-coded practices was tested against personal knowledge and phone calls to test the integrity of the data. (The confirmatory sample was found to be 100% concordant with the data collected from electronic sources.)
All data analysis including the calculation of PtP ratios was completed using Microsoft Excel 2003. Geographic boundary data for each collection district and suburb were integrated to the population, suburb boundaries and dental practice data using ArcGIS v10 (ESRI; http://www.esri.com/software/arcgis). All data for analysis were then extracted from the integrated geographically aligned database.
The total populations of NSW (6.5 million) and WA (1.9 million) were distributed across 2593 and 953 suburbs respectively. Suburbs were used as a model of any geographically defined set of non-overlapping regions (eg census tracts, states, counties). Suburbs were of very different sizes and geographic areas and had populations ranging downward from 39 000 (average=2400). Across these suburbs a total of 3545 separate general dental practices were distributed (2593 in NSW and 952 in WA). The PtP ratio for NSW was 2899 and for WA was 3260; for both states overall it was 2994. Figure 1 highlights that the highest PtP ratio is in suburbs towards the cores of the major capital cities; in rural and remote Australia the ratios are very low and in many cases zero.
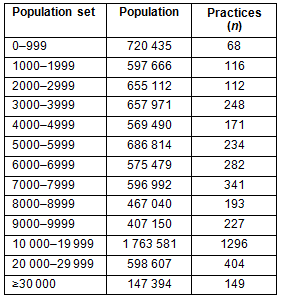
Each suburb was allocated to one of three outcome groups. Group 1 comprised suburbs with greater than (or equal to) 1500 residents and any dental practices present; Group 2 comprised suburbs with populations less than 1500 people (and dental practices); and Group 3 comprised suburbs with greater than 1500 people and no dentists. The level of 1500 as a population cut-off was chosen after consideration that 99% of practices were in suburbs greater than this size, as was more than 85% of the total population (Table 1). This grouping approach was taken to reduce the bias in statistics from making ratios based on low denominators (population) and to highlight suburbs where no dentist was present.
The total number of suburbs in Group 1 was 550 for NSW and 198 for WA while in Group 2 there were 1607 suburbs in NSW and 622 in WA. Most importantly in Group 3, where there was a population above 1500 but no practice, there were 436 suburbs in NSW and 132 in WA (Table 1). Calculating PtP ratios for Group 1 suburbs resulted in a NSW PtP ratio of 2899 and a WA PtP ratio of 3261. The standard deviation (ie measure of variance) was 2419 for NSW and 2440 for WA. This makes the standard deviation at a similar magnitude to the average (Fig2).
There were 4.3 million NSW residents living in a suburb with more than 1500 people and a dental practice, and approximately 1.2 million in WA. Across the two states, 2.3 million people were living either in a suburb without a practice or with a population of less than 1500 people and a practice.
The distribution of suburbs with low PtP ratios was clearly clustered around the core of the capital cities of each state (Fig1), with the lowest ratios being in suburbs of predominantly high net wealth (Fig1). The lowest PtP ratios were in the suburbs of Sydney (NSW), Bondi Junction (NSW) and Edgecliff (NSW) (53, 136 and 136 respectively) while the highest ratios (excluding suburbs with less than 1500 residents) were for Greystanes (NSW), Glenwood (NSW) and Kingsley (WA) (20 100, 13 900 and 13 300 respectively) (Fig3). The highest ratio was almost 400 times the value of the lowest ratio.
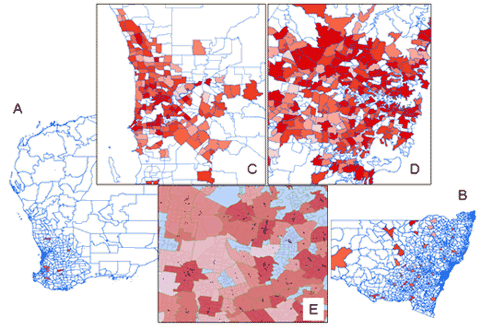
Figure 1: Practice-to-population ratio for each suburb (blue boundaries) of (A) Western Australia (WA)
& (B) New South Wales (NSW). C & D: Cores of the capital cities of NSW and WA, respectively, at high
resolution. The darker the shading, the greater the ratio (ie the more practices for a given population);
unfilled suburbs either had a population <1500 or had no dentists within their boundaries. E: Very high
resolution map of an area to show the overlay of suburbs (green boundaries) over census districts (grey boundaries)
and dental practices (black dots) with the transparent levels of red (as per C & D) for the different ratios.
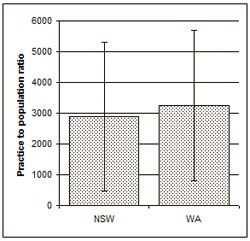
Figure 2: Average (& standard deviation) practice-to-population ratio for New South Wales (NSW)
and Western Australia (WA) based on suburbs with >1500 residents and at least one practice.
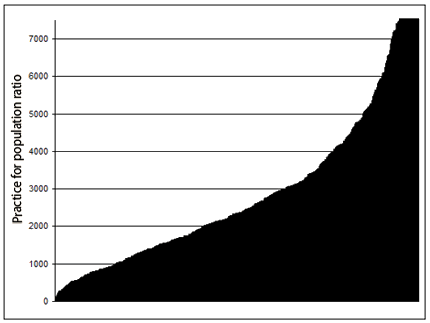
Figure 3: Practice-to-population ratio for each suburb in New South Wales and Western Australia
(integrated and ordered by the ratio). This figure only includes suburbs with a population >1500
and at least one dental practice. The x-axis represents suburb names of the two states
(not shown for clarity), ordered by the ratio of practice to population.
(The 40 suburbs with ratios greater than 7500 have been truncated at the right.)
Table 1: Total population and practice numbers for suburbs of different population sizes
Discussion
Dentist-to-population ratio is a very widely accepted measure of workforce outcomes3,4. In Australia it is regularly used to drive policy discussion4. It remains a very simple method to apply and has always been the conventional health planning technique. Workforce requirement is simply based on the size of the population, and desirable ratios are established on the basis of current situations, international comparison, recommended standards and extrapolation of past trends.
These ratios have some inherent risks, and their principal weakness is that they are insensitive to the complexity of the dental workforce planning process. Although not part of this study, it is clear that the uneven distribution of disease across geographic regions can play a role in determining supply and demand for dental care, although in a privately funded model, local population wealth may also be significant12. The application of dentist-to-population ratios does not account for differential transport options between areas, which are of particular relevance in highly unevenly distributed populations. Those people distant from services are often those with limited transport options, which impedes the uptake of care13.
The ratios also fail to account for the many variables that may affect the productive capacity of the healthcare system as well as the cultural, social and economic drivers in the population, which may influence levels of utilization. The application of such ratios in Australia, a continent that has arguably the most distorted population distribution anywhere (other than Antarctica), can significantly influence the clarity in statistical messages. Australian Aboriginal people are more likely to live in remote areas, and remoteness is a significant factor determining the level of basic health, education and infrastructure services to which Indigenous people have access12.
This study examined PtP ratio as an alternative (or at least a complement) to practitioner-to-population ratio. The study did not aim to make comment on the actual ratios presented (although the range is substantial) but to highlight the importance of PtP ratio as a measure of accessibility. Clearly, people do not stay within their respective suburbs to gain care, and many work in city centers and obtain care near to work13. However, the study clearly identifies that ratios vary widely across the states measured, and it is assumed to be consistent in other states. The differences in ratio between suburbs (where a practice was present) ranged from 50 to more than 20 000 (an almost 40 000% difference). In such a widely varying situation the presentation of average practice (or practitioner) to population ratios is misleading, although it does account for the part-time nature of some practices. This is particularly stark in rural and remote Australia where the majority of suburbs without practices are present and the lower ratios were clearly evident.
The research presented here focused on the ratio as a tool; however, it provides strong evidence of the significant mal-distribution of practices away from areas of high need and access difficulties (ie rural and remote Australia, including rural Aboriginal communities). These differences highlight the need for intervention to address the mal-distribution. Already, some early programs are starting to work on this through the placement of new dental schools in rural and remote Australia (in regional centers such as Cairns, Orange and Bendigo), as well as the far stronger emphasis on rural placements by the existing dental schools. The application of incentive programs for dentists to move practice is also a new innovation targeted at improving the situation. Similarly the internship scheme commencing in 2013 may have some impact, but it is yet to be tested.
It is also evident that the presentation of a standard deviation based on statewide calculations with a magnitude close to the average clearly identifies the risks involved in presenting average ratios. No statistical inference can be made in this situation. It is evident that PtP ratios are a vital tool for measuring dental workforce in a highly irregularly distributed population such as Australia.
Practice-to-population ratios were calculated suburb-by-suburb for two Australian states (WA and NSW) that had similar overall practitioner-to-population ratios. The difference between suburbs was almost 40 000%, an important finding on its own. More importantly, the study highlighted the inherent advantages of using PtP ratios in situations where the unevenness of population distribution is so great. The ratio provides an inherent measure of accessibility. The outcome clearly highlights the need for such measures to be used when policy decision-making to address mal-distribution is at the forefront of the government's mind. The need for more high-resolution accessibility detail in rural and remote (and especially rural Aboriginal) communities, when it comes to workforce planning, is vital to the future research landscape in dental population health.
References
1. Australian Bureau of Statistics (ABS). Australian Social Trends. Cat. no. 4102.0. Canberra, ACT: ABS, 2010.
2. Kruger E, Smith K, Atkinson D, Tennant M. The oral health status and treatment needs of Indigenous adults in the Kimberley region of Western Australia. Australian Journal of Rural Health 2008; 6: 283-289.
3. Australian Bureau of Statistics (ABS). Australia's health work force: selected health occupations. Canberra, ACT: ABS, 2006.
4. Spencer AJ, Teusner DN, Carter KD, Brennan DS. The dental labour force in Australia: the position and policy directions. Population Oral Health Series No. 2. Canberra, ACT: Australian Institute of Health and Welfare, 2003.
5. Teusner DN, Chrisopoulos S, Spencer AJ. Projected demand and supply for dental visits in Australia: analysis of the impact of changes in key inputs. Dental Statistics and Research Series no. 38, cat. no. DEN 171. Canberra, ACT: Australian Institute of Health and Welfare, 2008.
6. Australian Institute of Health and Welfare. Dental workforce. (Online) 2013. Available: http://www.aihw.gov.au/dental-workforce (Accessed 27 August 2013).
7. Koletsi-Kounari H, Papaioannou W, Stefaniotis T. Greece's high dentist to population ratio: comparisons, causes, and effects. Journal of Dental Education 2011; 75: 1507-1515.
8. Treasure E. Dental workforce issues in the United Kingdom. Journal of Dental Education 2004; 68: 23-25.
9. Guthrie D, Valachovic RW, Brown LJ. The impact of new dental schools on the dental workforce through 2022. Journal of Dental Education 2009; 73: 1353-1360.
10. Australian Bureau of Statistics (ABS). Census dictionary Australia. Cat. no. 2901.0.2006. Canberra, ACT: ABS, 2006.
11. Kruger E, Tennant M, George R. Application of geographic information systems to the analysis of private dental practices distribution in Western Australia. Rural and Remote Health 11: 1736. (Online) 2011. Available: www.rrh.org.au (Accessed 26 August 2013).
12. Smith K, Kruger E, Dyson K, Tennant M. Oral health in rural and remote Western Australian Aboriginal communities: a two-year retrospective analysis of 999 people. International Dental Journal 2007; 57: 93-99.
13. McGuire S, Kruger E, Tennant M. Travel patterns for government emergency dental care in Australia: a new approach using GIS tools. Australian Dental Journal 2011; 56: 389-393.
