Across the western world, equity of access to primary health care (PHC) services is a fundamental goal of rural health policies and planning1. In Australia, national and state strategic plans and frameworks are committed to providing equitable access to PHC, regardless of where people live2. At the same time, faced with a growing demand for health care, governments and health authorities also seek to maximise service efficiency and effectiveness. The need to balance these three requirements of equity, efficiency and effectiveness is a complex task, nowhere more so than in non-metropolitan areas, where delivery costs are high and health needs are great.
Unfortunately, many rural and remote communities are characterized by significant inequities in PHC service availability, quality/performance and sustainability3. This variation reflects the nature of PHC services required by different communities, the costs of providing them, and specific barriers to their delivery, with both community size and geographical remoteness among the key determinants. Therefore, governments and health service providers continue to seek ways to improve equity of access to PHC.
Three important questions underpin the formulation of appropriate health policies to guide the equitable, efficient and effective provision of PHC services in rural and remote regions of Australia:
- What core PHC services should be available to all Australians, regardless of geographical location?
- How might these core PHC services be provided in a manner appropriate to different geographical contexts?
- What are the costs associated with delivering high quality core PHC services across different geographical locations?
To date, rigorous empirical research has been undertaken into the first two questions4-8. In contrast, empirical evidence relating to the cost of delivering high quality PHC efficiently and effectively (and the extent to which these costs vary geographically) is virtually non-existent. This article investigates how best to ascertain the costs of delivering high quality core PHC services across different geographical locations through reporting the research findings from a pilot study seeking to redress this knowledge gap. The specific aim of the study was to ascertain whether it is possible to estimate the total, per capita and per consultation costs of providing high quality PHC services in rural locations of different population sizes, and to describe the methodological issues associated with such an exercise. As these estimates are derived from high quality services, they can potentially be used as benchmarks against which other services can be compared.
This was a complex exploratory study and it is important to understand the contextual issues related to costing of rural PHC services. The introduction summarises the current macro-scale policy used by the Australian Government to ensure equitable funding for provision of PHC services across states and territories, relevant literature pertaining to the meso-scale task of PHC resource allocation and different costing methods, and availability of existing national data sets relating to expenditure, utilisation and performance.
Improving equity through fiscal equalisation
In Australia, significant geographical variation exists in both primary care and acute care expenditure. Costs of services increase with distance from capital cities9, the use of hospital services increases and the use of Medicare-funded PHC services decreases. For example, in 2006-07, residents of rural and very remote areas received approximately only three-quarters and one-half of the expenditure of major city residents respectively10.
For many years, several adjustments, including for geographical remoteness and indigeneity, have been incorporated into government policies of fiscal equalisation11 and the associated resource allocation weightings12. Underpinning fiscal equalisation, the Commonwealth Grants Commission (CGC) recommends how revenue raised from the Goods and Services Tax (GST) should be distributed to Australian states and territories in order to provide these governments with the capacity to provide comparable services for their populations regardless of where they live. Factors the Commission considers include indigeneity, population dispersion, socioeconomic status and diseconomies of scale. A cost gradient in service provision is recognised, which accounts for higher costs for providing equivalent services in rural and remote areas (compared with capital cities) due to higher wages, greater costs for freight, communication and housing. The CGC also recognises that jurisdictions in which populations receive lower Medicare Benefit Schedule (MBS) and Pharmaceutical Benefit Schedule (PBS) funding from the Australian Government will need to provide more state and territory funded community health services, and will therefore need more GST revenue to compensate for those costs13. The calculations on which these adjustments are based reflect current patterns of service delivery and hence are unlikely to fully account for the relative cost of achieving truly equitable access to PHC. Although the current system of horizontal fiscal equalisation implemented by the CGC is a mystery to almost the entire Australian community14, arguably without it larger disparities than currently exist would arise15.
Funding arrangements and resource allocation formulae designed to improve equity of access to PHC services would be strengthened by empirical evidence on the costs associated with achieving high performing PHC services in rural and remote settings. This evidence could underpin funding and workforce benchmarks that could be used to monitor improvements in equity. For example, workforce and related funding benchmarks could facilitate improved workforce recruitment and retention programs and underpin more efficient resource allocation necessary to improve equity in the provision of PHC services. Moreover, PHC service benchmarks would assist in monitoring and evaluating variation in health outcomes, and facilitate the comparison of service performance across jurisdictions after taking account of population size, location and need.
Benchmarking for service equity
Benchmarking usually refers to an ongoing, systematic evaluation of organisational products, services and processes, most commonly associated with organisations attempting to improve their performance in order to emulate best practice16. Through yielding a standard by which something can be systematically measured or judged, benchmarking provides an opportunity to better determine the inputs and processes required to achieve performance goals. Benchmarking is used in acute health services and for some clinical processes in primary care17,18. The use of benchmarking for PHC services at a national level is arguably more complex and challenging than its application within a narrower area of service provision, largely because the parameters under examination vary widely in how they are defined, are often highly interrelated, and are less easily measured.
In view of this, relevant literature pertaining to PHC resource allocation and different costing methods was examined, together with existing national data relating to PHC service expenditure, utilisation and performance.
Lessons from the literature: In healthcare literature, equity is often defined in terms of achieving an allocation of resources across groups (including geographic regions) that reflects the relative needs of those groups. Equity can be defined across several dimensions such as equity in inputs, equity in access, equity in service provision and equity in outcomes19,20. Achievement of equity in any one of these dimensions may be important for the achievement of equity in another. However, in some instances achievement of an equity goal may imply a very different allocation of resources to another19. By their nature equity objectives involve a manifestation of values. Mooney et al (2002) describe the concept of claims or reasons why one group should be allocated more resources than another. Claims can be developed and weighted using a resource allocation formula, and adjusted through a process in which community values are articulated (surveys, focus groups, citizen's juries). This approach includes a degree of self-assessed health and reflects community views. Allocation of resources may differ within, between and across communities, adding a layer of complexity in the process21.
A key component of equity of access to health care is needs-based funding. Needs-adjusted capitation formulae have been adopted in many systems to guide the allocation of resources to local health providers or services, reflecting assessment of population need rather than current utilisation. Factors considered in these formulae may include indicators of the relative need for health services and cost of service provision. For example, the former resource distribution formula in the health system of the state of New South Wales used standardised mortality ratios, socioeconomic variables, age, gender and indigeneity as indicators of relative need22,23, and a dispersion cost factor to recognise the higher cost of providing state-supported PHC and community health services in rural areas.
Although reliable data (timely and accurate) are required to ensure accuracy and evaluation of health outcomes, even rudimentary population data can be used15. This method was further developed in the Northern Territory (NT) with the introduction of the Expanding Health Service Delivery Initiative. This joint initiative of the NT and Australian Government aimed to expand PHC services and improve health infrastructure (housing, clinics and communication systems). Funds were allocated according to need, and a per capita funding benchmark was established for each local health service delivery area:
Benchmark = national average MBS payment x (agreed remoteness factor + fluency in English factor + NT cost of service delivery factor)24
Several significant methodological issues should be addressed in undertaking best practice in costing health services. Methodological issues to be considered include the study perspective, uncertainty, validity, generalisability and availability of data25. Some common methods include direct measurement of costs (top-down, bottom-up or mixed methods), cost accounting methods, standard unit costs, fees, charges or market prices, and estimation/extrapolation based on literature.
In measuring costs directly, the bottom-up approach, also referred to as micro-costing, is seen to be more reliable and therefore a preferred approach. Clinical services are broken down into steps, each requiring detailed resource utilisation measurements. However, this method is time consuming, expensive and may be impractical25. In addition, it may lead to an inaccurate estimate of costs at a more global level. The complexity and resource intensiveness of this approach were confirmed in a previous pilot examining the cost of providing services for two chronic diseases26. In contrast, a top-down approach is a useful and reasonably accurate method, breaking services down into larger components. It is simple, cheaper and faster, may be able to tackle regional variability, and generally leads to more accurate estimates at the global level. It may be less accurate as large resource units are measured25.
The literature provides little guidance in several issues. There is no clear agreement on a 'best' approach, although it is acknowledged there is often a trade-off between data accuracy and the feasibility of obtaining data. No matter which method is adopted, costs should be measured in the same way using transparent methods. Many studies make an assumption that services being compared will have similar health benefits and that the cost objects are the same or similar. The potential study biases (including those related to scale, case mix and site selection) need to be addressed or acknowledged. There is little guidance on how to deal with missing data and variations in input processes. Misleading or absent data can lead to unfair comparison and flawed policy choice25. In short, the decision on how best to measure the costs of providing equitable health care is complex, and very much dependent on the availability of good data.
Australian data sources: PHC in Australia is complex, fragmented and often uncoordinated27. Failure to adopt a national single patient identifier has slowed the development of a system-wide approach, linking clinical and financial information and development of more robust adjustment methods and modelling of health resource allocation, which would contribute to more efficient and effective allocation of funds for populations28.
Australian health expenditure data are collated by the Australian Institute of Health and Welfare and the Australian Bureau of Statistics (ABS), based on data obtained from the Department of Health (including MBS and PBS), and state and territory health authorities (hospital morbidity data and state/territory expenditure returns). Other sources of data include population health surveys, health registers and surveillance systems. Currently, administrative data describing PHC expenditure come largely from MBS and PBS, which focus on general practice and pharmacy respectively, supplemented by data from Aboriginal Community Controlled Health Services (collected by the Department of Health) and state/territory based data.
Each data source is not without its problems. If available, there is invariably a delay in accessing timely information from these sources. State/territory based data are typically aggregated and not readily available for specific geographic areas. Moreover, data can only provide information about service users, not about those with poor access to PHC29. Frequently, these data cannot be easily linked and do not include the wide range of PHC services provided by other health workers. National expenditure data describing government funded community health services are not available. Private sector data from general practitioners and private health insurers are often inaccessible at a national level.
Because relevant national data were not available, and given the resource intensiveness of a bottom-up approach26, the present study focused on applying a largely top-down costing approach to a sample of similar high performing rural PHC services located in different geographical settings, with a view to costing the inputs necessary to provide a comprehensive suite of core PHC services, and ascertaining how these costs might vary according to geographical location and community size.
A sample of high performing primary care practices in rural communities was identified using data from the Australian Primary Care Collaborative Program (APCC)30. Practices were selected using 'quality scores' based on a range of 'improvement measures'. The researchers chose measures that described the management of diabetes and coronary heart disease, where all practices operating from a high base received an overall score indicating whether the practice had improved, declined or remained the same in regard to meeting evidence based targets for registered patients over a 12-month period.
Initially, practices were selected in rural communities (Australian Standard Geographical Classification Remoteness Areas (ASGC-RA) 2-3) and assigned a population count to the communities they served using ABS census data (urban centre locality). The researchers excluded practices that were in close proximity to metropolitan areas, those that formed regional centres such as the Sunshine Coast in Queensland, the Central Coast and the Illawarra in New South Wales and those with a population greater than 5000.
Four different sized population groups were chosen based on previous research7: 101-500, 501-1000, 1001-3000 and 3001-5000. Practices were stratified by jurisdiction, population group, ASGC rating and then by their APCC quality score. Lists of all practices that met these criteria were validated by rural PHC experts in each jurisdiction as well as the principal clinical advisor of the Improvement Foundation Australia, which provided the APCC data. The research team then selected practices from the validated list for invitation to participate in the study.
A data collection tool was developed to capture information describing annual operating costs (both capital and recurring), human resources, PHC services provided and reflections from practice principals on issues related to provision of sustainable high quality primary care in a changing environment. The tool was piloted.
The study collected primary data that were locally representative and allowed detailed analysis25. A retrospective, top-down approach was used to collect large scale cost data for the main components of the total cost of providing a high performing primary care service. Recurrent cost data included human resources, professional development, recruitment, communication, vehicle operations, buildings, drugs, supplies, medical consumables and equipment, accounting, legal, medical insurance expenses and other. Capital costs and depreciation relate to land and buildings, vehicles and equipment.
Information describing the practice's human resources was collected according to professional category and measured in number, full-time equivalents (FTEs) and number of funded vacancies. Capital costs and depreciation data concerning land and buildings owned or leased by practices were measured in square metres and costs of depreciation or leases in the financial year 2012-13. Depreciation and leasing costs were collected for vehicles, equipment including computers and other IT and measured in costs of depreciation or leases.
These methods were chosen because they were transparent and relatively straightforward, data were available from all practices, and due to time and funding constraints25. Financial data available from practice taxation/accounting records for the 2012-13 financial year, measured in Australian dollars, were used.
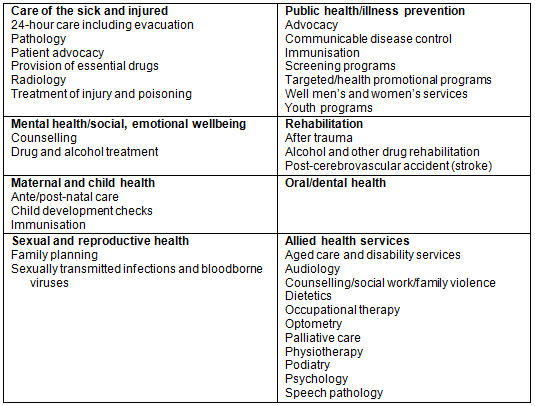
Based on a list of core PHC services developed in previous research5 (Table 1), the researchers asked each practice principal if their practice provided that service. Principals were asked specifically about services, not service providers, recognising that in rural areas doctors, nurses and other healthcare professionals provide a wide range of basic PHC services.
Practices were visited between March and July 2014. Each practice was paid a A$1000 honorarium in acknowledgement of the time required to complete the survey and participate in interviews. Data were analysed using Excel 2010.
Table 1: Core primary health services that all Australians should be able to access, regardless of where they live5
Ethics approval
Ethics approval was obtained from the Central Australian Human Research Ethics Committee (HREC-12-57).
Two high performing primary care practices in each of the population groups of 101-500, 501-1000, 1001-3000 and one from the 3001-5000 group agreed to participate in the study.
Most core PHC services were provided in situ, at least in the first instance, with the exception of radiology, some allied health (excluding counselling/social work/family violence, aged care and disability services and palliative care), oral/dental services and youth services (Table 2).
Several different measures of the population served by each of PHC were derived. These included the ABS estimated population for the locality (used to categorise the practices), patients currently registered (which included patients from the locality and from neighbouring localities) and patients who attended once in the last financial year. For all of the PHC services, the number of patients registered exceeded the ABS estimates of population for the locality. This was mainly due to patients registered at the practice who lived outside the immediate locality, although other factors may also be at play.
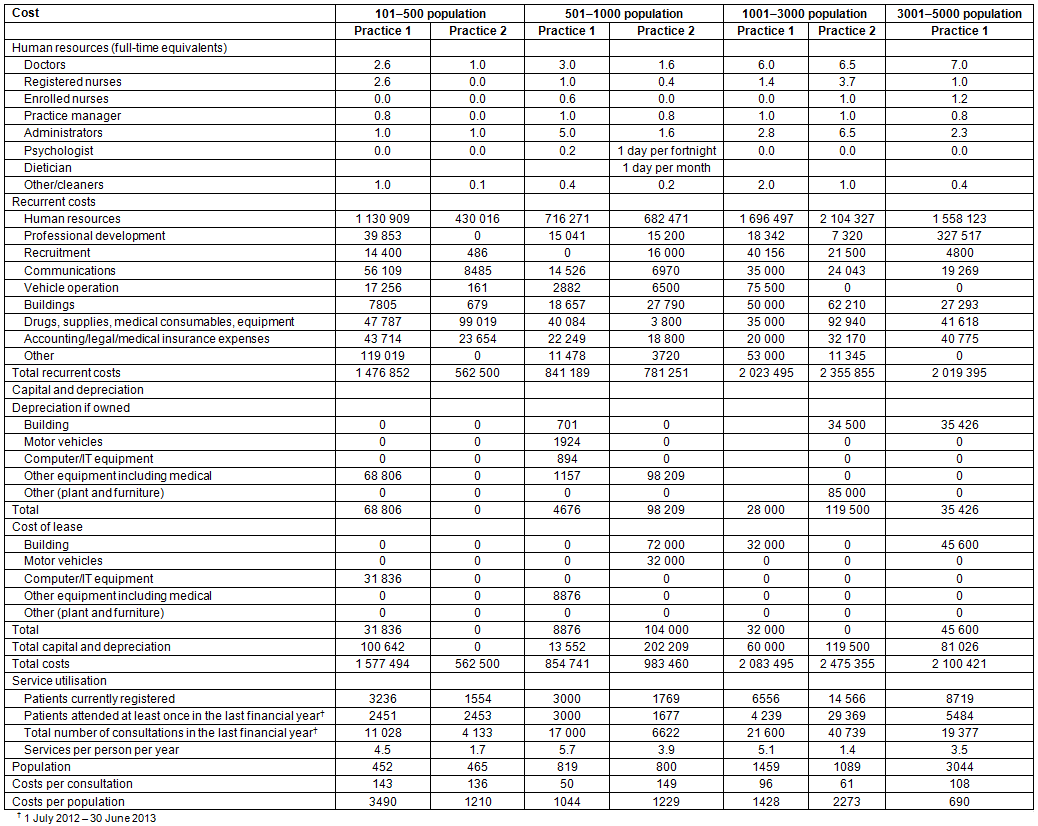
The data exhibited wide variation in total recurrent costs ranging from A$562,500 to A$2,475,355 (Table 3). Capital and depreciation costs also varied significantly and were dependent on individual business arrangements. Total annual costs (recurrent + capital and depreciation) also varied across practices. The smallest practice (in terms of expenditure) did not report capital expenditure, but for other practices total annual costs ranged from A$854,741 to A$2,475,355.
Table 2: Core primary healthcare services provided by high performing practices in rural Australian contexts by population group, 2013
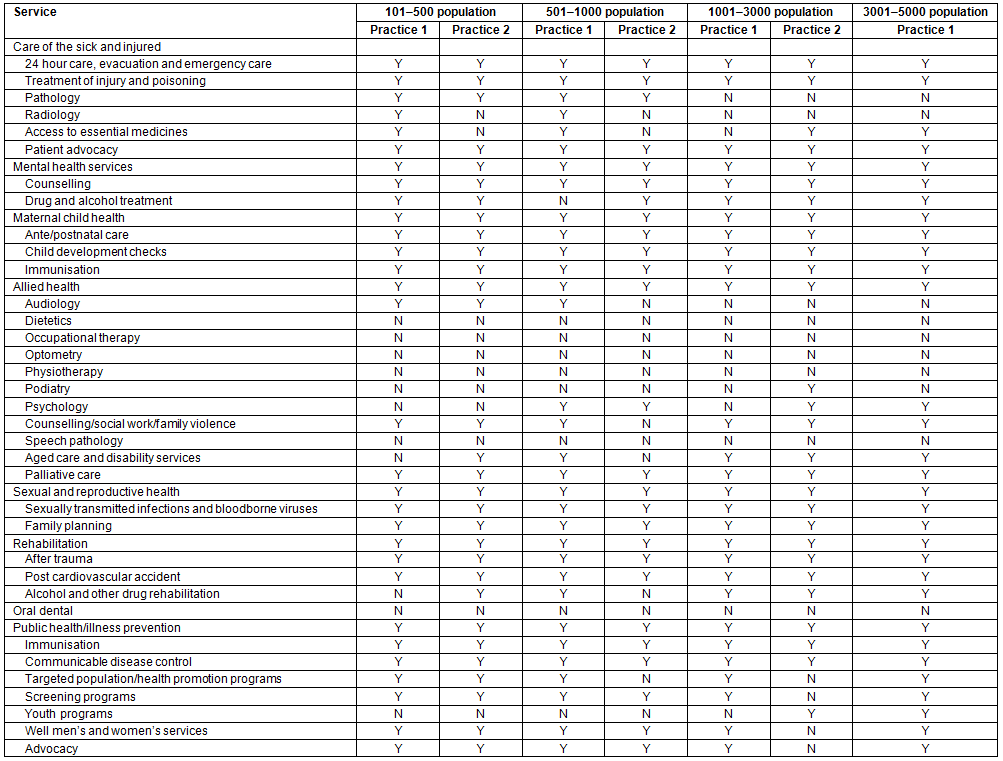
Table 3: Annual costs (A$) of high performing primary healthcare practices in rural communities in Australia by population group, 2013
There was a very weak association between total annual costs and costs of practices grouped by the size of the local community. A stronger association was evident when the size of current patients registered with the practice was considered. The cost per person registered with the practice declines as the number of patients registered increases (Fig1).
All PHC services had a core of medical, nursing and administrative staff delivering the bulk of primary care services, while in the smaller communities allied health services were provided by part-time, visiting staff or by other providers in the town. All practices were staffed primarily by doctors, with the number ranging from 1.0 FTE to 7.0 FTE (Table 3). The ratio of FTE doctors per 1000 population (using the ABS estimates) ranged from 2.0 to 6.0. When expressed as FTE doctors per 1000 registered patients, the range was from 0.45 to 1.00 (Fig2). All practices employed nurses, with the number of FTEs varying across population groups. When both doctor and registered nurse FTE are considered, a similar association between FTE per 1000 registered patients is evident (Fig2).
Most of the recurrent costs for all practices were attributed to human resources and ranged from 69% to 85% with an average of 77%. Doctors' salaries accounted for 47-65% of total annual costs with an average of 53%. Costs per consultation ranged widely across practices ($50-149). There was no apparent relationship between cost per consultation and community size. However, there was some evidence of an association between cost per consultation and the number of registered patients, with unit cost falling as the size of the registered patient population increases (Fig3).
None of the practices employed nurse practitioners, midwives, oral health practitioners or allied health professionals (including occupational therapists, physiotherapists, podiatrists, social workers and speech pathologists) although one practice had a visiting audiologist, another had a visiting dietician once a month and three practices had a regular visiting psychologist. No costs were incurred by the practices for these visiting services.
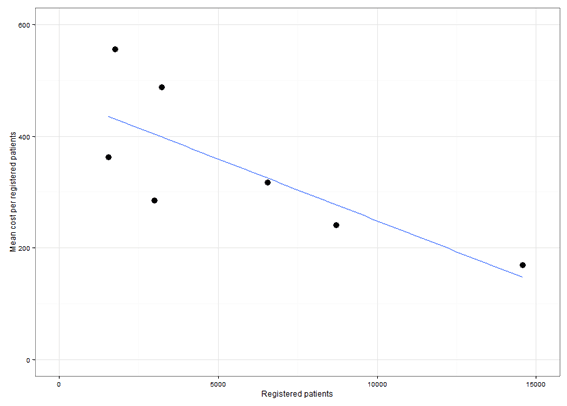
Figure 1: Mean cost per registered patient by number of registered patients: high performing primary healthcare practices in rural communities in Australia, 2013.
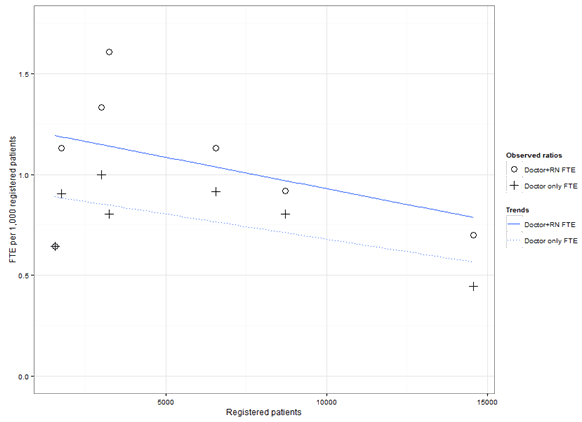
Figure 2: Full-time equivalent primary care doctors and registered nurses per 1000 registered patients by number of registered patients: high performing primary healthcare practices in rural communities in Australia, 2013.
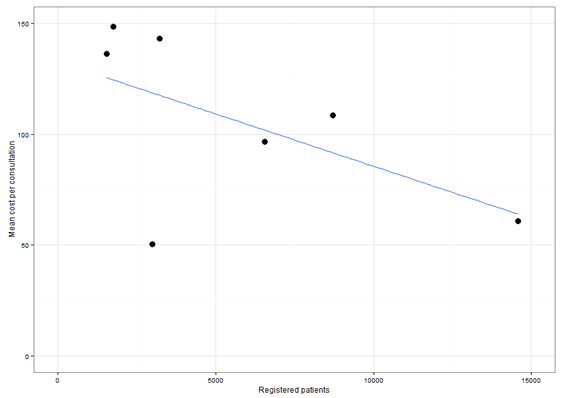
Figure 3: Mean cost per consultation by number of registered patients: high performing primary healthcare practices in rural communities in Australia, 2013.
Discussion
This pilot study was undertaken to assess the feasibility of collecting data with which benchmarks for rural primary care could be developed. The authors were not able to develop definitive benchmarks due to the limitations discussed below. The study also highlighted the paucity and inadequacy of available national data that would enable top-down research into either the costs of funding rural PHC services or the development of funding benchmarks for primary health care. Nevertheless, such yardsticks are vital if governments and health authorities are to provide adequate funding to achieve their desired policy goals of ensuring equity of access for all Australians, regardless of where they live, and to overcome the limitations of historical funding patterns.
Undoubtedly a major limitation of this pilot is the small sample size, which was a function of time and resource constraints. Two researchers travelled large distances to visit practices. The initial assessments took approximately half a day, and follow-up was required. Only one invited practice declined due to ill health of the principal. The small sample size resulted in considerable variability in the service costs for communities of a comparable size. Although it is not possible from the study data to discern how the costs of delivering high quality core PHC services vary according to size of the local population, there is some weak evidence of an association between costs and the size of practice population. The empirical research into high performing rural PHC services nonetheless highlights several significant issues that need to be addressed in seeking to benchmark rural PHC services. These insights are grouped around five main considerations.
1. Accurately specifying the nature and scope of PHC services offered by the service
Although core services were defined consistently with previously published research7, there was considerable variability from location to location in terms of what services were provided. This issue has also been recognised elsewhere25. Clearly, a key requirement for benchmarking is being able to ensure consistency across the particular services being costed in different geographical contexts.
2. Defining consistently the nature of the patient population within the PHC service catchment
While high performing PHC services were carefully sampled and allocated to similar population size categories in order to ascertain whether expenditure varied according to community size, it became evident from the field work that service catchments differed greatly, with many instances of catchment 'leakage' and transient patient populations impacting upon the service. Hence the ABS population figures that were used to define community catchments did not necessarily equate with the actual service population. Without being able to accurately determine what the denominator should be, there were problems in ascertaining accurately costs per capita, costs per unit of service, and costs per patient seen at least once in the previous 12 months.
3. Categorising the service models in order to compare 'like' with 'like' and take account of extended service provision arrangements whenever several organisations deliver PHC services in a collaborative arrangement
Although the sample of high performing practices was constructed on the basis of best available PHC clinical outcome data, the field work revealed the existence of widely differing models of service delivery within the sample. Moreover, the quest to minimise variation between models was further complicated by instances where the service operated in close collaboration with other local, nearby or visiting services to ensure the provision of comprehensive PHC, but where both staffing and funding relationships were somewhat blurred. Indeed, in contrast to PHC services provided inhouse, the actual costs of other PHC services associated with coordinated care in the location were sometimes difficult to account for and are not included in this study.
4. Ensuring a comprehensive collection of all costs
Ideally, accurate benchmarking requires data relating to service operating costs and staff remuneration. The field work showed that many services do not retain comprehensive data relating to all aspects of their costs in a readily available repository, so costings were sometimes found to be incomplete or only estimates. Moreover, expenditure figures sometimes could not be easily disaggregated into the categories sought for this research.
5. Other methodological issues
Despite considerable planning and piloting of the methodology (built around existing literature, previous experience and the advice of several experts) the fieldwork data collection constituted a complex process. Reasons for this included dependence on access to a few key people in the PHC service, their conflicting priorities in generating the data, the difficulties associated with disaggregating data within the very complex funding arrangements, defining and identifying high performing services and their sustainability over time.
It would be useful to benchmark the costs associated with providing high quality PHC services in rural communities of different population sizes, in order to maximise funding equity based on evidence-based formulae rather than antiquated historical funding formulae or the 'squeaky wheel gets the grease' syndrome31,32.
Where to from here? It should be acknowledged that while much of benchmarking is focused on identifying and costing the factors that determine the financial performance of the service, other considerations are important. In particular, performance must be measured against expectations, both of the community itself and the health professionals who are essential to delivering high quality care. Although many small rural communities are among the most socioeconomically deprived in Australia, their needs for good PHC are among the greatest. In the absence of locally available services, the obstacles (both financial and geographical) to accessing alternative PHC have resulted in high levels of preventable disease and morbidity as a result of non-utilisation of PHC services in a timely manner. So the quest to establish funding and workforce benchmarks for high-performing rural PHC services should not be placed in the 'too-hard basket'.
Based on this research the authors would encourage continued research on two related fronts. First, given the ongoing collection of data by governments and health authorities pertaining to health services, existing national data sets should be made more accessible to researchers with the express purpose of reviewing their value for costing and possibly benchmarking sustainable, high performing rural PHC services. Data describing costs of providing outreach and other services by government community health centres would provide additional information useful in benchmarking PHC. A particular requirement is for data to be available at a more detailed geographical level, so that the effects of differing practice catchments can be more adequately addressed. Regardless of its limitations, much of the data currently collected in Australia is either not used or remains inaccessible, despite the demands this places on health services.
Second, national rural health and related professional peak bodies should investigate the potential to combine their resources with a view to undertaking a national empirical survey of the costs of providing high quality PHC across rural Australia. In this regard, it should be noted that a similar landmark study, funded by the Australian Government, was undertaken several years ago to investigate viable economic and organisational models of rural and remote general practice8. Through its mobilisation of doctors practising in rural and remote areas, significant participation was achieved in this study, and the resulting data enabled benchmarks to be developed for rural general practice. Because comprehensive primary care is provided by so many other health professionals, it would be essential that the study engaged them fully.
Acknowledgements
The authors acknowledge the important contribution of Mr Jim Pearse, Director of Health Policy Analysis, Sydney, Australia. As a consultant, Mr Pearse provided valuable assistance in design of the data collection tool, analysis of results and in the broader discussion. Authors also thank Dr Amr El Noor, Dr James Dunbar, Dr Dennis Pashen, Dr Dale Ford and Dr Carole Reeve for their assistance in identifying high performing primary care practices and the staff in participating primary care practices.
The research reported in this article is a project of the Australian Primary Health Care Research Institute, which is supported by a grant from the Commonwealth of Australia as represented by the Department of Health. The information and opinions contained in it do not necessarily reflect the views or policy of the Australian Primary Health Care Research Institute or the Commonwealth of Australia (or the Department of Health).
References
1. World Health Organization. The World Health Report: Primary health care (now more than ever). Geneva, 2008.
2. Australia Government Department of Health. National Primary Health Care Strategic Framework. Canberra, Australia; 2013.
3. Humphreys JS, Wakerman J, Wells R. What do we mean by sustainable rural health services? Implications for rural health research. Australian Journal of Rural Health. 2006; 14(1): 33-35.
4. Carey T, Wakerman J, Humphreys J, Buykx P, Lindeman M. What primary health care services should residents of rural and remote Australia be able to access? A systematic review of 'core' primary health care services. BioMed Central Health Services Research 2013; 13(1): 178.
5. Thomas SL, Wakerman J, Humphreys JS. What core primary health care services should be available to Australians living in rural and remote communities? Biomed Central Family Practice 2014; 15(143).
6. Wakerman J, Humphreys J. Sustainable primary health care services in rural and remote areas: innovation and evidence. Australian Journal of Rural Health 2011; 19(3): 118-124.
7. Thomas SL, Wakerman J, Humphreys JS. Ensuring equity of access to primary health care in rural and remote Australia - what core services should be locally available? International Journal for Equity in Health 2015; 14(1): 111.
8. Mildenhall D, Chater A, Mara P, Maxfield N, Owens C, Rosenthal D, et al. Viable models of rural and remote practice: stage 1 and stage 2 reports. Kingston, ACT: Rural Doctors Assocation of Australia, 2003.
9. Australian Institute of Health and Welfare. Australian health expenditure by remoteness: a comparison of remote, regional and city health expenditure. Health and welfare expenditure series no. 41. Cat. no. HWE 50. (Internet) 2011. Available: http://www.aihw.gov.au/publication-detail/?id=6442475421 (Accessed 29 October 2015).
10. Australian Institute of Health and Welfare. Australian health expenditure by remoteness: a comparison of remote, regional and city health expenditure. Health and welfare expenditure series no. 50. Cat. no. HWE 50. Canberra: AIHW, 2011.
11. Humphreys JS. Social provision and service delivery: problems of equity, health, and health care in rural Australia. Geoforum 1988; 19(3): 323-338.
12. Australian Government. Report on GST revenue sharing relativities 2015 review. Volume 1. Canberra: Australian Government Commonwealth Grants Commission, 2015.
13. Australian Government. Report on GST revenue sharing relativities - 2013 update. Canberra: Australian Government Commonwealth Grants Commission, 2013.
14. Office of the Coordinator-General for Remote Services. Office of the Northern Territory Coordinator-General for remote services report, June 2011-August 2012. Darwin, NT: Office of the Coordinator-General for Remote Services, 2012.
15. Smith P. Formula funding of health services: learning from experience in some developed countries. Geneva: World Health Organization, 2008.
16. von Eiff W. International benchmarking and best practice management: in search of health care and hospital excellence. International best practices in health care management. Advances in Health Care Management 2015; 17: 223-252.
17. Bailie R, Matthews V, Brands J, Schierhout G. A systems-based partnership learning model for strengthening primary healthcare. Implementation Science 2013; 8(1): 1-12.
18. The Health Roundtable Ltd. Annual report 2014. (Internet) 2014. Available: https://www.healthroundtable.org/Portals/0/PublicLibrary/Annual%20Reports/HRTAnnualReport2014.pdf (Accessed 27 February 2016).
19. Culyer AJ. Efficiency, equity and equality in health and health care. CHE research paper 120. (Internet) 2015. Available: http://www.york.ac.uk/media/che/documents/papers/researchpapers/CHERP120_Efficiency_Equity_Equality_Health_Care.pdf (Accessed 27 February 2016).
20. Mooney GH. Equity in health care: confronting the confusion. Effective Health Care 1983; 1(4): 179-185.
21. Mooney G, Jan S, Wiseman V. Staking a claim for claims: a case study of resource allocation in Australian Aboriginal health care. Social Science & Medicine 2002; 54(11): 1657-1667.
22. Gibbs A, Sondalini R, Pearse J. The NSW health resource distribution formula and health inequalities. New South Wales Public Health Bulletin 2002; 13(3): 42-44.
23. Segal L. A vision for primary care: funding and other system factors for optimising the primary care contribution to the community's health. Health and Hospital Reform Commission. Prevention Theme. Canberra: University of South Australia, 2008.
24. Department of Health and Ageing. Evaluation of the child health check initiative and the expanding health service delivery initiative: summary report. Canberra: Australian Government, 2011.
25. Mogyorosy Z, Smith P. The main methodological issues in costing health care services: a literature review. CHE research paper 7. York: Centre for Health Economics, University of York, 2005.
26. Gador-Whyte A, Wakerman J, Campbell D, Lenthall S, Struber J, Hope A, et al. Cost of best-practice primary care management of chronic disease in a remote Aboriginal community. Medical Journal of Australia 2014; 200(11): 663.
27. Australian Institute of Health and Welfare. Australia's health 2012. Canberra: AIHW, 2012.
28. Donato R, Segal L. The economics of primary healthcare reform in Australia - towards single fundholding through development of primary care organisations. Australian and New Zealand Journal of Public Health 2010; 34(6): 613-619.
29. Australian Institute of Health and Welfare. Health expenditure Australia 2011-12. Health and welfare expenditure series no. 50. Cat. no. HWE 59. Canberra: AIHW, 2013.
30. Australian Primary Care Collaboratives Program. Results. (Internet) 2012. Available: https://apcc.org.au/about-apcc/results/ (Accessed 27 February 2016).
31. Clapp J. Benchmarking your practice. New Jersey Medicine 2001; 98(11): 51-53.
32. Elmuti D, Kathawala Y. An overview of benchmarking process: a tool for continuous improvement and competitive advantage. Benchmarking for Quality Management & Technology 1997; 4(4): 229-243.


