With an estimated 525 000 new cases in 2012, head and neck cancers are the eighth most common non-melanoma cancers globally1. This number is expected to grow significantly in the coming decades, resulting in increased demand for treatment2.
To maximize efficiency, comprehensive cancer treatment facilities are most commonly located in areas where they service the largest proportion of the patient population, generally in large urban centers. This results in a geographical inequity, such that individuals living farther from a cancer treatment center experience a greater travel burden in order to attend their treatment, particularly those living in rural and remote areas3. This travel burden has been shown to have significant effects on patients' tumor stage and grade at the time of diagnosis4-9, decisions concerning treatment3,10-13, and survival14. The time required for patients to travel from the home to a cancer treatment center is therefore an important factor throughout the continuum of care, and may inform more efficient and equitable cancer control programs and policy.
The travel time required for an individual to reach a treatment center provides a quantitative measure of access15. However, an individual's access to a health service may also be measured as the 'degree of fit' between that individual and the health system with which they are interfacing16. This broader definition encompasses social, economic, cultural, and structural barriers to entry into a health system17. For example, while an individual may live near a hospital, their ability to obtain medical care may be inhibited by vehicle non-ownership, language barriers, cultural norms around health, the economic inability to miss work or obtain child care, poor public transit provision, lack of systemic requirements such as medical insurance or a fixed address, and family caregiver needs, to name but a few. These non-spatial dimensions of access reflect a socioeconomic component that authors argue is a vital ingredient in both the accurate modelling of access to health services and informing policy decisions18. Socioeconomic deprivation can therefore be considered a proxy variable for non-spatial access to treatment. Further, while socioeconomic deprivation is a well-established predictor of cancer incidence19-24, rates of treatment25, and survival24,26-29, there is some evidence that these socioeconomic disparities also reflect poor spatial access to screening, diagnosis, and treatment6,7,24,30-33.
In order to provide more geographically equitable access to treatment in British Columbia (BC), Canada, the British Columbia Cancer Agency has established five new comprehensive cancer treatment centers since 1995, in addition to the original BC Cancer Centre in the city of Vancouver. Using spatial-temporal mapping of head and neck cancer patients from 1981 to 2009, this study sought to quantify how the establishment of new cancer treatment centers has affected patients' spatial access treatment, and how these trends vary by socioeconomic deprivation and between urban, suburban, and rural patient populations.
Methods
Head and neck cancer incidence data were provided by the British Columbia Cancer Registry, comprising all patients who received a histologically confirmed diagnosis in the province of BC from 1981 to 2009, inclusive. The following tumor sites were selected, corresponding to the International Classification of Diseases in Oncology, version three site codes for head and neck cancers: C003-5 (mucosa of upper and lower lips); C020-23 (dorsal surface, ventral surface, border and anterior two-thirds of tongue); C028-29 (overlapping lesions of tongue and tongue); C030-31, 039 (upper and lower gum); C040, 041, 048, 049 (anterior, lateral floor of mouth, overlapping lesions of floor of mouth, floor of mouth); C050-52, 058, 059 (soft palate, hard palate and uvula, overlapping lesions of palate, palate); and C060-62, 068, 069 (cheek, vestibule of mouth, retromolar area, mouth, and unspecified parts of the mouth)34.
The following patient variables were captured at the time of diagnosis: patient age, sex, primary tumor site, date of diagnosis, and residential postal code. Following the removal of incomplete or erroneous records, 11 050 individual patient records remained for analysis. Age- and sex-adjusted incidence rates per 100 000 were calculated for each tumor site and 5-year interval, using the direct method based on the 1996 BC standard population. For the final interval (2005-2009), a 5-year rate was estimated based on a linear extrapolation of the 4-year incidence. Each patient's home location was mapped, based on their postal code at the time of diagnosis.
Geographical information systems were used to compute estimated travel times based on a digital road and ferry network that includes intersections, speed limits, and other features that affect vehicular egress. These data were used to calculate an estimated drive time from each patient's postal code to the nearest cancer treatment center at their time of diagnosis. For this analysis, the geometric center of each postal code area was used (in the year 2011, a postal code in BC had an average of 35 residents, 14 dwellings, and a mean and median area of 379 ha and 0.83 ha, respectively). Postal codes in rural and remote regions are larger than their urban and suburban counterparts. As the analysis used the center of a postal code area as the starting point for the drive time analysis, there is a degree of error in the resulting figures (eg if a patient actually lives near the border of their postal code area). This is particularly true in rural and remote areas, where postal code zones are large. To visualize how new cancer treatment centers affected spatial access, catchment areas around each treatment center were mapped to identify the areas within 30, 60, 120, 180, and 240 minutes of travel time, for each decade since 1981.
Population data were obtained from Statistics Canada for every census year in the study period (5-year intervals from 1981 to 2006) and mapped by census dissemination area, the smallest geographical unit publicly available, each containing 400-700 residents with a mean and median area of 13 805 ha and 26 ha, respectively. The mean dissemination area size is positively skewed by several large areas in rural and remote regions of BC. Population densities were used to classify dissemination areas as urban (>400 persons/km2), suburban (150-400 persons/km2), or rural (<150 persons/km2), according to the definition from Statistics Canada and the Organisation of Economic Cooperation and Development35. Patients were thus categorized by their neighborhood type (urban/suburban/rural) at their time of diagnosis, thereby accurately classifying patients living in rural neighborhoods that later became suburban, for example.
The local socioeconomic deprivation score for every census dissemination area was calculated using the Vancouver Area Neighbourhood Deprivation Index (VANDIX), a composite metric of health-related deprivation based on the following weighted variables from the 2006 Canadian census: average income, workforce participation rate, unemployment rate, proportion of lone-parent households, high school non-completion, proportion of population without a university degree, and proportion of home owners36. Data from the 2006 census were used due to their relatively high accuracy compared to previous census years, although they may inaccurately reflect socioeconomic status for patients diagnosed early in the study period due to neighborhood change. Data from previous census years was excluded for four reasons: preliminary experimentation demonstrated a limited degree of socioeconomic change in most neighborhoods from 1981 to 2011; changes to the definition of key census variables were made mid-study period (eg employment and workforce participation rate); changes to census dissemination area definitions and boundaries were made, particularly between 1986 and 199123; and some key variables in VANDIX were made non-mandatory in 2011, reducing their reliability. Every patient was assigned their local neighborhood deprivation score, and all patients were then classified into deprivation quintiles (Q1= least deprived/highest socioeconomic status; Q5 = most deprived/lowest socioeconomic status).
Patient and risk population drive times to the nearest treatment center were cross-tabulated by socioeconomic deprivation and neighborhood type to identify differential patterns between urban, suburban, and rural patients, following from the authors' previous work23. To apply parametric tests, drive times were log-transformed to normalize their distributions. Bivariate linear models were fitted to test for correlations between mean travel time and socioeconomic deprivation. Independent t-tests between contiguous deprivation quintiles were then conducted to identify where significant differences in mean travel time occurred. Bonferroni-corrected alpha thresholds were used to assess significance (trend tests: α=0.017; difference of means: α=0.0125). Statistical analyses were conducted using the Statistical Package for the Social Sciences v 23 (SPSS; http://www.spss.com).
Ethics approval
Approvals for this study were obtained through both the Simon Fraser University Research Ethics Board (2013s0753) and the British Columbia Cancer Agency/University of British Columbia Research Ethics Board (H08-00839).
Results
Of the 11 050 patients records analysed, 33.3% were female. The distribution of patients' neighborhood type was 76.4% urban, 8.5% suburban, and 15.1% rural, consistent with the population distribution of BC. A total of 62% of patients lived within 1 hour of a treatment center at their time of diagnosis, while only 3% lived more than 12 hours by automobile and/or ferry (Table 1). All of these distributions were temporally stable throughout the study period.
Age-adjusted incidence rates were found to vary across the study period, as shown in Figure 1. Suburban and rural rates have increased overall, with the sharpest increase observed for suburban patients, as previously reported for oral cavity cancers23.
The observed socioeconomic gradient of travel time to comprehensive cancer treatment is consistent, with the most significant disparities observed for the most deprived 40% of suburban patients, and the most deprived 20% of rural patients, the majority of whom live in remote regions of north-western BC. As shown in Figure 2, the deprivation-travel time trend is linear and significant among patients residing in urban neighborhoods (R2=0.98, p<0.001; b=0.2, p<0.001), with a steeper increase among suburban patients (R2=0.92, p=0.005; b=0.28, p<0.005). In rural neighborhoods, the trend is non-linear (R2=0.68, p=0.04; b=0.16, p<0.04) but features an increase in mean travel time among patients residing in the most deprived neighborhoods (Q4 and Q5).
Significant differences between contiguous socioeconomic quintiles are denoted by asterisks in Figure 2. For urban patients significant increases in mean travel time were identified between all quintiles except for Q4 to Q5. Among suburban patients, a significant break is observed from Q3 to Q4 and is the greatest increase across all categories. Similarly, the only significant increase among rural patients is in the most deprived neighborhoods (Q4 to Q5), representing patients residing in the most remote communities.
As shown in Figure 3, the time-series maps of the comprehensive cancer treatment centers illustrate both the densification of treatment in south-western BC (Surrey, opened in 1995, and Abbotsford in 2008), and expansion into less populous regions such as the Okanagan Valley (Kelowna in 1998), Vancouver Island (Victoria in 2001), and most recently in the rural and remote north (Prince George in 2012).
While the establishment of new treatment centers has contributed to a decreased patient travel times in recent decades, an increase is observed for rural patients from 2005 to 2009, as shown in Figure 4. Statistically significant differences in travel time were observed between neighborhood types, because the majority of comprehensive cancer treatment centers are located in BC's major urban centers. A widening disparity between neighborhood types in the most recent time period (2005-2009) is indicative of a rise in head and neck cancer incidence farther from urban centers.
Similarly, decreases in travel time were observed for all five socioeconomic deprivation quintiles, as shown in Figure 5. However, while average travel times for the three least deprived quintiles are converging around 1 hour, recent increases are observed among the two most deprived quintiles (Q4 and Q5), demonstrating a clear inequality in access to treatment between socioeconomic groups, particularly in rural and remote regions, despite the densification and expansion of cancer treatment centers across BC.
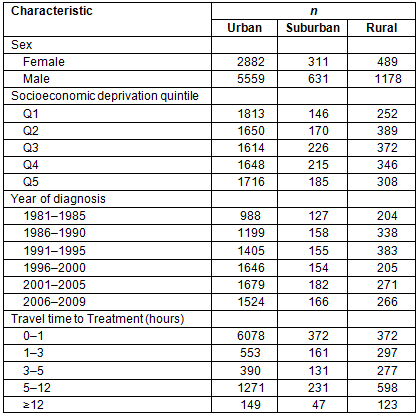
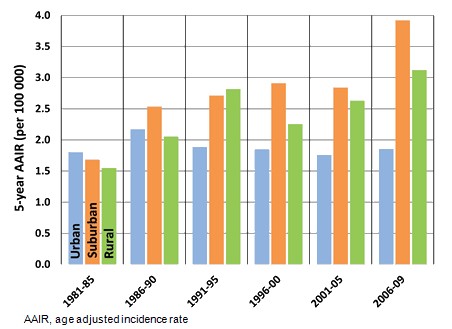
Figure 1: Five-year age-adjusted incidence rates per 100 000.
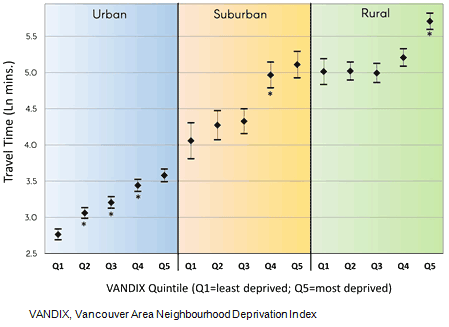
Figure 2: Natural log-transformed travel times to nearest cancer treatment center by neighborhood type and Vancouver Area Neighbourhood Deprivation Index quintile, with means and 95% confidence interval. Asterisks denote statistically significant increases in travel time above previous quintile.
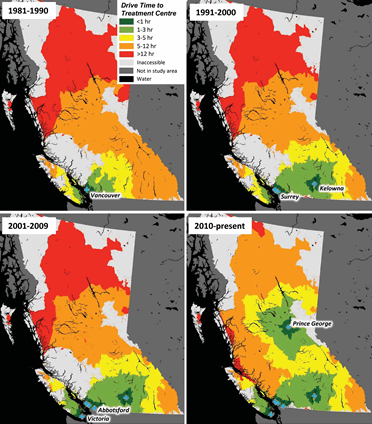
Figure 3: Time-series maps of British Columbia Cancer Agency comprehensive cancer treatment centers, by decade. Colored regions indicate drive time to the nearest center.
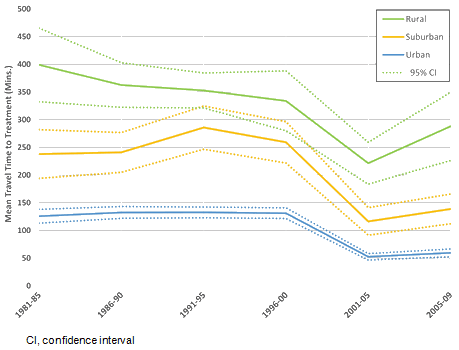
Figure 4: Mean travel time to nearest treatment center for each neighborhood type by 5-year period, with 95% confidence interval. While overall decreases are observed, the recent increase in travel time for rural patients indicates a growing demand in rural and remote regions.
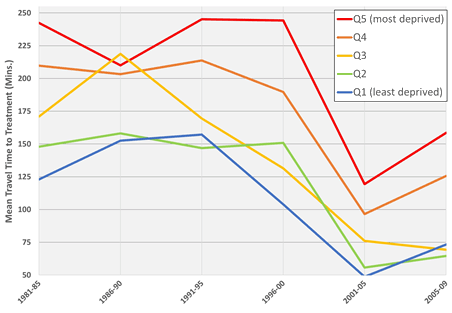
Figure 5: Mean travel time to nearest treatment center for each socioeconomic deprivation quintile by 5-year period. A convergence of average travel time is observed for the three least deprived quintiles of patients, while recent increases are observed for the two most deprived quintiles.
Discussion
This study provides evidence of a strong socioeconomic gradient in spatial access to cancer treatment using a composite weighted index of neighborhood socioeconomic status. Patients residing in the most socioeconomically deprived neighborhoods were found to have the longest travel time to treatment. This combination of poor spatial access may be aggravated by non-spatial barriers facing socioeconomically deprived patients living in those neighborhoods, for example, low financial resources and reduced ability to navigate the health system.
By differentiating patients by urban, suburban, and rural residence, a consistent socioeconomic gradient in travel time was identified across all three neighborhood types. Interestingly, the greatest gap in travel times was observed for suburban patients living in neighborhoods above the 60th percentile of socioeconomic deprivation. This finding is suggestive of a sharp geographical boundary separating more affluent suburban populations nearer urban cores (where the cancer treatment centers are generally located) from their less affluent counterparts on the suburban periphery37. The distinctly higher travel burden observed among rural patients is consistent with previous studies4, although the present findings further identify a socioeconomic difference among these populations. The most deprived quintile of rural patients had a median travel time of 6 hours: 14 times that of the most deprived urban patients, and 33 times that of the most affluent urban patients. While this has been observed, albeit to a lesser degree, in previous studies4, the authors are yet to identify any similar findings along dual socioeconomic and spatial axes in the literature. However, it must be noted that the observed degrees of difference in this study may be amplified by BC's large size and remote northern half, a geographically unique configuration when compared to other studies of access to cancer treatment. For those patients living in remote regions, air travel is the only realistic option for travelling to cancer treatment centers, the costs of which are largely prohibitive. Given that decisions regarding cancer treatment are inherently influenced by complex psychosocial processes, a precise estimate of a temporal threshold at which a patient will elect to travel for treatment is unrealistic. Initiatives to reduce barriers to access should therefore incorporate both geographical and social considerations; for example, treatment via air travel may be more realistic for a patient living in a remote region were there a financial mechanism to assist with the cost.
The magnitude of difference in travel times between socioeconomic groups was greater than expected, and underscores the relative dual burden of spatial and aspatial access experienced by patients in BC's most deprived areas. While the well-documented covariance between rurality and socioeconomic deprivation certainly serves as an explanatory factor, the degree to which deprived suburban and rural populations experience barriers to cancer treatment remains a significant challenge for health services planning. This is particularly true in settings with large, remote tracts of sparsely inhabited land, such as BC and Northern Canada.
Temporally, this study provides evidence that the establishment of new cancer treatment centers in BC has led to overall decreases in patients' average travel time, particularly since the Kelowna center opened in 1998, greatly expanding the geographical extent of services across the Southern half of the province. However, recent increases in travel time among the most socioeconomically patients may be evidence of growing socioeconomic deprivation in suburban locales most notably in the outer suburban neighborhoods of major centers such as Vancouver and Victoria. This pattern is consistent with the present study's previous findings but merits further investigation23.
While this study does provide strong evidence of socioeconomic and geographical disparities in spatial access to cancer treatment among head and neck cancer patients, several limitations merit attention. Aetiological differences between different head and neck cancer subtypes may be reflected in their geographical distributions across the study area. However, the number of cases was not sufficient to conduct a subanalysis by tumor site. Because this study used estimated driving and ferry times from patients' residential postal code, the actual travel time a patient experiences may differ, particularly in remote regions, where air travel may be necessary. The actual placement of cancer treatment centers is determined by a wide range of factors, including population forecasts and economic calculation. Limited chemotherapy treatments have recently become available in small community centers across the province. However, further data are required in order to examine the effect these centers have on patient access across the province.
Conclusions
Significant socioeconomic disparities in patients' estimated travel time to a comprehensive cancer treatment center were observed in urban, suburban, and rural areas, with a consistent and increase by deprivation quintile. This combination of spatial and socioeconomic barriers may significantly impact low-socioeconomic status patients' ability to receive treatment. However, while the expansion and densification of comprehensive cancer treatment centers in British Columbia has led to decreases in travel time from 1981 to 2009, socioeconomic disparities in access remain throughout the study period. The construction of cancer treatment centers in rural and remote regions is not economically feasible; however, programs (such as financial and logistical travel assistance) to reduce barriers to treatment among populations living in these regions may improve treatment rates, and ultimately, patient survival. Future studies should seek to quantify the impact of community cancer clinics in rural and remote regions and assess the feasibility of assistance programs for patients who reside in those areas.
Acknowledgements
The authors wish to acknowledge the British Columbia Cancer Agency and Ryan Woods at the British Columbia Cancer Registry for facilitating the data acquisition and providing logistical support. S. Lear holds the Pfizer/Heart and Stroke Foundation Chair in Cardiovascular Prevention Research at St. Paul's Hospital. This study was funded by the LiVWELL Research Group.
References


