Introduction
Malnutrition is a clinical condition that includes several overlapping syndromes, such as growth failure in children and muscle wasting in adults. These may be the result, primarily or secondarily, of an inadequate supply, relative to the body's needs, of energy and/or essential nutrients1,2. Malnutrition is globally the most important risk factor for illness and death, contributing to more than half of the deaths of children worldwide. There is a high and increasing prevalence of malnourishment among children aged 5 years and below in parts of Africa, Asia and Latin America and the Caribbean. Protein-energy malnutrition (PEM), vitamin A deficiency, iodine deficiency disorders (IDD) and nutritional anaemia (mainly due to iron deficiency or iron losses) are the most common serious nutritional problems in most countries in Asia, Africa, Latin America and the Near East3.
In Malaysia, the percentage of children with moderate to severe malnutrition in the year 2000 was high4, despite government efforts to provide food baskets. A total of 6.1 million Malaysian RM was spent across the country in 2000 to assist 5186 children5. States on the east coast of Peninsular Malaysia have the highest reported cases of moderate to severe malnutrition among children 5 years and below. In Kelantan, one of these states, moderate malnutrition in 24% and severe malnutrition in 5.9% was reported6.
Extensive studies into the causes of malnutrition among children have shown that the causes are interrelated, diverse in nature, multisectoral and involve many different aspects of life7. Understanding the relative contribution of individual, household and community predictors of health outcomes is important for policy-makers to assist in designing appropriately targeted public health interventions. However, many studies of malnutrition among children have not investigated the interrelationships of all components. The present study attempted to use structural equation modelling (SEM) - an extension of the general linear model - in order to test a set of regression equations simultaneously. This identifies phenomena or 'causal' processes that generate observations of multiple variables8. Because few frameworks explain the causes of malnutrition among children, this study adopted the framework proposed by Sastry9, which focused on the macro levels of families and the community. In the comprehensive approach offered by this framework, each identified factor is classified as a biological, behavioral or environmental aspect. The main objective of this study was to use SEM to develop a model that offers a plausible explanation for identified relationships.
Methods
Subjects
The state of Kelantan was chosen for this study because it has the highest rates of moderate (24%) and severe (5.9%) malnutrition6. A systematic random sampling method was used to select the sample of 295 children aged 0-5 years (134 boys and 161 girls). The sampling frame was constructed from children who attended for a routine medical check-up at a clinic between June and December 2007. One child and his/her mother corresponded to one household unit. The sample size was based on the calculation of 15 respondents per variables8. Subjects were excluded if they had a chronic illness/condition that could influence their health status, or if they suffered from mental or physical retardation (eg Down syndrome). Only subjects accompanied by their own mother/caregiver were selected to avoid biased reporting.
Ethics approval was obtained from the Ethics Committee of Universiti Sains Malaysia. All participants who consented to the study were informed of their right to withdraw from the study without having to provide a reason. Participants were guaranteed anonymity and that all information provided would be kept confidential.
Research instrument
An in-depth interview was conducted using a question guide developed based on Sastry's conceptual framework9. The main theme explored during the in-depth interview was contributing factors to malnutrition. A total of 20 health workers who worked with malnourished children were interviewed and the findings of these interviews were used to construct a conceptual framework (Fig1). A questionnaire was then developed based on the conceptual framework.
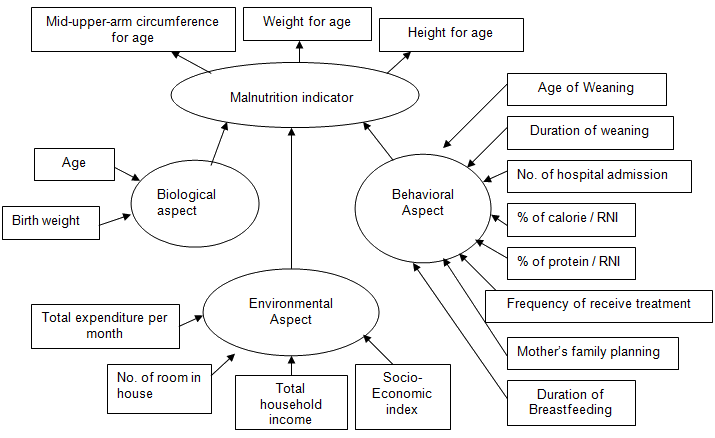
Figure 1: Proposed theoretical model.
A panel of nutrition experts and researchers then critically examined, discussed and provided inputs into the content of the questionnaire; they also assisted in refining it. The questionnaire was further tested for its psychometric properties before it was used in the field to collect quantitative data. Psychometric tests gave no indication of linear dependency or any identity matrix, and all variance was within acceptable ranges.
Factor loadings rotated under Varimax with Kaiser Normalization revealed three main factors: biological, behavioral and environmental. Anthropometry data such as weight, length/height and mid-upper arm circumference were collected to the nearest 0.1. The resulting questionnaire, available in the Malay language, contained 50 items that assessed respondents in 7 domains: (i) background information (race, religion, gender, age, education level, marital status, occupation); (ii) housing conditions (type of ownership and house, number of rooms); (iii) basic necessity and utilities (availability of schools, health facilities, grocery shops, water supply, electricity, telephone, toilet, sewage disposal, waste disposal, and use of cooking fuel); (iv) property and land ownership (ownership of a vehicle and household products as well as land); (v) income and expenditure; (vi) child health status (anthropometry, health history, feeding practices); and (vii) diet (24 hour recall, food preparation).
Socioeconomic status was measured according to the ownership of vehicles and basic household products. Each item owned was graded according to a point system where the higher the points, the higher the socioeconomic status. The Z-scores for weight-for-age, height-for-age, and mid-upper arm circumference (MUAC)-for-age were derived using EpiNut Anthropometry (Epi Info, v3.3.2; CDC USA). A face-to-face interview using the questionnaires was conducted with the children's mother or caregiver, based on a 24 hour recall. To overcome any bias, information about the parents' meal, especially the mother's, was obtained because their children usually shared the same food. Assessment of the content of food intake was based on Nutrient composition of Malaysian Foods10. In order to calculate the nutritional status of the child, a comparison was made with the Malaysian Recommended Intake (RNI) 200511.
Statistical analysis
Statistical analysis was performed using SPSS for Windows v14 (SPSS; Chicago, IL, USA) for descriptive analysis. The correlation matrix was generated using Pearson's r to determine the correlation coefficient of each item. The presence of items with very strong relationships (rxy >.80) may result in singular covariance matrices, which prevent an SEM solution. In another words, the analysis could not be carried out if there was multicollinearity among the indicator variables.
Further analysis on SEM was performed using Analysis of Moment Structure v6 (AMOS: ADC, Chicago, IL, USA). This analytic approach involves a two-step process12. In the first step, observed variables are hypothesized to measure the underlying constructs and tested using confirmatory factor analysis. This leads to the establishment of a measurement model where the validity of an item of a latent variable is determined by the magnitude of its deviation from the standardised regression estimate B value of the path of an indicator variable to the latent variable in the model. Before proceeding with subsequent steps, an assessment of the validity and reliability of each observed variable are carried out using the 3 indicators: individual item reliability using squared standardized loading, overall reliability using composite reliability, and average variance extracted.
The second step focuses on testing hypotheses about relationships among the variables in the structural model. The criteria for assessing the structural model is the same as the measurement model, using path significance or standardised regression estimates (B). Evaluation of both the measurement and structural models also involves use of fit indices13-15. The χ2 statistic provides a test of the null hypothesis, ensuring that the theoretical model fits the data. Non-significant p-values indicate a good fit. A root mean square error of approximation (RMSEA) value close to 0.06, and adjusted goodness-of-fit index (AGFI) and comparative fit index (CFI) values close to 0.9 indicate acceptable fit of the model. The AMOS also allows the use of modification indices to improve the model fit χ2 by drawing a correlation function between the identified variables8. However, the establishment of these relationships must be supported by strong theoretical evidence. All the hypothesized paths in the conceptual model (Fig1) were tested and included in the structural model; however, only paths that were significant (p <.05) are shown in the final results.
Results
Description of the sample
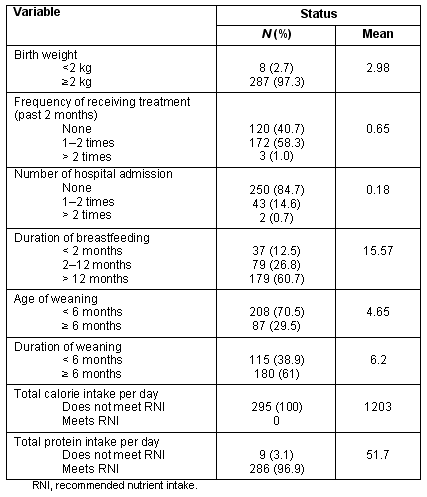
A total of 295 respondents (94% of the targeted response) were recruited from 10 clinics with a distribution of 27-31 children from each clinic. Respondents' health status and background information are shown (Tables 1,2).
Table 1: Household sociodemographic information
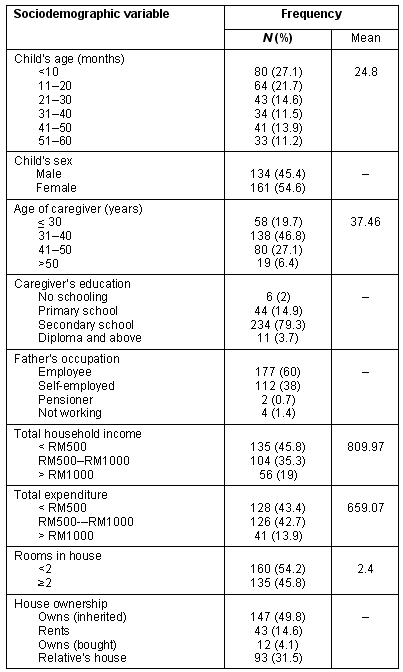
Table 2: Child health status
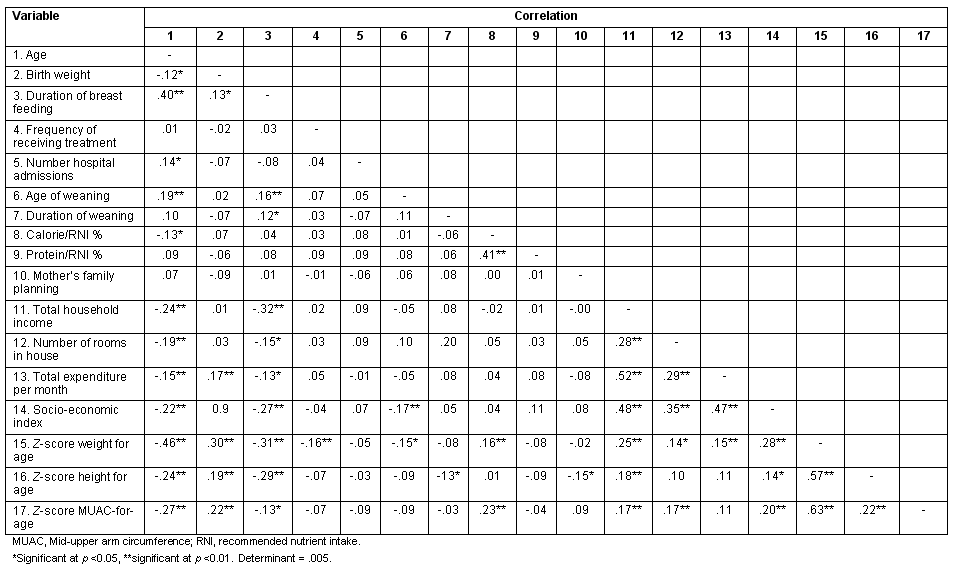
Correlations between predictor variables and malnutrition indicators (weight-for-age, height-for-age, MUAC-for-age) are shown (Table 3). All the predictor variables were significantly correlated with Z-score weight-for-age, except number of hospital admissions, duration of weaning, percentage of protein in recommended nutrient intake (RNI), mother's family planning, number of rooms in the house, and total expenditure per month. For Z-score, height-for-age, age, birth weight, duration of breastfeeding, duration of weaning, mother's family planning, total household income, socioeconomic index, and Z-score weight-for-age were significant correlated. The Z-score weight-for-height showed similar results, with the exclusion of duration of breastfeeding, total household income, and the inclusion of percentage of calories in RNI. The Z-score for MUAC-for-age was significantly correlated with age, birth weight, duration of breastfeeding, percentage of calories in RNI, total household income, number of rooms in house, and socioeconomic index.
Table 3: Correlations among study variables
Structural equation modelling
Measurement model: Initially the hypothesized model was generated from the predicted paths among observed and latent variables predicted from the literature and by qualitative data collection method (Fig1). To test the reliability of the hypothesized measurement model, confirmatory factor analysis was conducted. The χ2 values for the measurement model indicated that the data fit the model, by a non-significant p-value. The RMSEA values were found to be below 0.06, and AGFI and CFI were above 0.9, indicating acceptable fit of the model. However, of the three constructs (behavioral, biological and environmental), only the environmental construct met the recommended lower threshold value of validity (Ν) and item reliability (r2). Individual item reliability for the environmental construct was assessed by squared standardized loading for each item. The composite reliability obtained was 0.75, which met the recommended value of 0.60. Finally, the AVE from this subscale was 0.43, which is slightly below the threshold of 0.5.
The structural model
A path diagram of the structural model of factors that influence malnutrition is shown (Fig2). Only paths that were significant are shown in the diagram. The RMSEA was 0.04 (90% confidence interval 0.01 to 0.07) with a p-value for the test of closeness of fit of 0.585, AGFI 0.959, and CFI 0.984, all of which indicated an acceptable fit. The χ2 value for the structural model was 21.708, with degrees of freedom of 14 (p>0.05). Only one construct (environmental) was found to influence malnutrition.
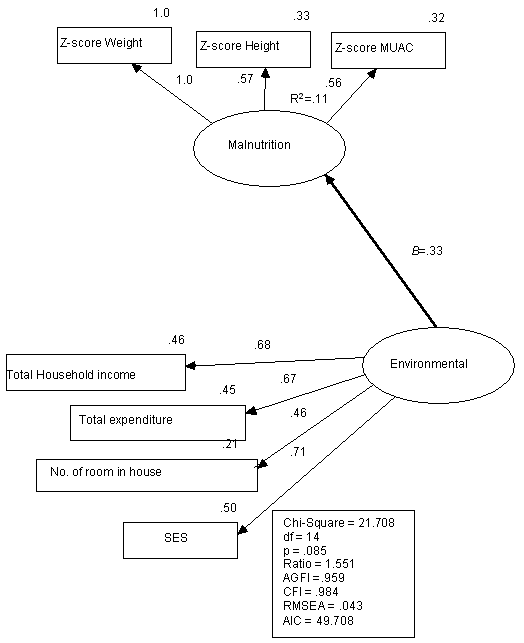
Figure 2: The structural equation modelling model.
Discussion
Empirical studies have shown that the factors contributing to malnutrition among children are well established and have been stable over time. An understanding of these factors is essential for planners and policy-makers when designing and implementing intervention programs. Structural equation modelling was chosen for this study because of it indentifies causal relationships among hypothesized constructs, rather than simple associations. It is a rigorous approach to determining the systematic and statistical significance of the covariance between each construct and outcome in a path diagram (Fig2). The path diagram also shows the sequence of constructs and distinguishes collinearlity between the predictors, supporting the causal evidence of this study.
This study has identified four determinants as the predictors of malnutrition among children: (i) total household income; (ii) total expenditure; (iii) number of rooms in the house; and (iv) socioeconomic status. This indicates that the environmental factor is the main contributor to malnutrition among children aged 5 years and below in Tumpat, Kelantan. Of the four determinants, socioeconomic status is the strongest predictor (factor loading = 0.71). Households with improved socioeconomic status usually indicate that they are also financially advantaged. After expenditure of income on food and basic necessities (eg water, electricity), the remainder is spent on household products (eg television, radio, washing machine, DVD player) and a motor vehicle for convenience. Households with improved socioeconomic status are likely to have children with a higher weight-for-age Z-score16.
The next predictor is income (factor loading = 0.68). The mean household income was RM809.97, which falls into the first quartile of average household income among Malaysians. Approximately 45.8% of the respondents were from the income group 'less than RM500 per month'. Lower income was very much related to occupation because 60% of the studied population was employed in the construction industry. Most of these jobs were unreliable because they are based on the availability of housing projects. The remaining population (38%) was at home and working according to based market demand. Low family income was associated with stunting (RM655.34 ± 414.73), wasting (RM689.68 ± 576.68), underweight (RM651.15 ± 482.24), and MUAC-for-age below -2 standard deviations (SD) (RM761.38 ± 767.89). This indicates that those with malnutrition are more likely to belong to a low income group. This finding was similar to that of Norhayati et al.17 and Aflah18, where poverty affected the majority of the households with food insecurity. Despite Government assistance via maternal and child care clinics in the provision of a 'food basket' for malnourished children 5 years and below, these children will face the same problem after that age. Once they exceed the food basket age limit and enter primary school, there is no certainty that they will qualify for the food supplement assistance program provided by the Ministry of Education (breakfast at school) because transition from the clinic to school is not clearly defined. Continuing malnourishment will affect their school performance19.
Similarly, total household expenditure showed an average of RM659.07 per month was available for expenditure at home. This is high considering that average income was reported to be RM809.97. During the data collection respondents revealed that little could be saved each month, although the cost of living in the studied areas was low. The situation worsened during festive times or when school re-opened. The study indicated a relationship between household expenditure and malnutrition (stunting = RM578.02 ± 297.32; wasting = RM568.86 ± 314.99; underweight = RM589.13 ± 307.67; MUAC-for-age below -2 SD (RM481.49 ± 152.05). During the north-east monsoon season, main economic activities (mostly related to agriculture and aquaculture) are severely affected by flooding. Due to income disruption, many families have difficulty in providing food at home. Although a study by Murni et al20 indicated that the majority of the malnourished children in Tumpat live in an area with the potential for further development of agricultural activities, the field observations and interviews of the present study indicated otherwise, with few families reporting access to suitable land for home-grown agriculture to generate extra income. However, future research could usefully study the potential of home-grown agriculture for family intervention efforts.
The number of rooms in the home was the weakest predictor for malnutrition (factor loading = 0.46). It was also positively correlated with income (r = 0.28, p <0.01), Z-score for weight (r = 0.143, p <0.05), and Z-score for MUAC-for-age (r = 0.172, p <0.01). This finding is in agreement with a study by Bendley et al.21, where a lower number of rooms at home was found to be associated with a lower income. Approximately 49.8% of the families inherited their house from parents or ancestors. Due to financial constraints they simply managed with whatever was available and were not able to accommodate every occupant in comfort.
The evidence in this study did not support a link between biological and behavioral constructs for malnutrition. This is an interesting finding because the calorie intake of the children was reported to be low (1203 ± 457.51 kcal/day). However the duration of breastfeeding as reported was within the recommended range (14.55-19.49 months), with weaning introduced at 4.71-5.03 months. The study also revealed a low level of infections or illnesses among the studied population during the previous 2 months. This was probably due to the presence of healthcare services within reach of the villagers.
Conclusion
In the final model developed for this study, environmental factors are the key causes of malnutrition among children. Thus, rather than target other factors (behavioral and biological) exclusively, interventions and preventive strategies should focus on improving the environmental conditions (eg monthly income, socioeconomic status) of households. This approach should be taken in the context of limited funding (eg rural areas) when prioritization of interventions is required. Efforts should be focused on socioeconomical improvement, such as generating job opportunities for women.
Because this study was conducted in the Tumpat district in Kelantan, generalization can only be made to sites with similar characteristics. However, future research could usefully study the ability of households or individuals to obtain sufficient resources to meet current needs, and inequality in the distribution of income, consumption or other attributes across the population in both monetary and nonmonetary dimensions.
References
1. Desai S. Maternal education and child health: a feminist dilemma. Feminist Studies 2000; 26(2): 425-448.
2. WHO Expert Committee on Physical Status. The use and interpretation of anthropometry. Geneva: WHO, 1995.
3. Latham MC. Human nutrition in the developing world. Food and nutrition series no 29. Rome: UN Food and Agriculture Organization, 1997.
4. Ministry of Health Malaysia. Annual Report 2000. Kuala Lumpur: MOH, 2000.
5. Ministry of Health Malaysia. National Plan of Action for Nutrition of Malaysia II (2006-2015). Kuala Lumpur: National Coordinating Committee on Food and Nutrition, Ministry of Health Malaysia, 2005.
6. Zulkifli A, Khairul AA, Atiya AS. The nutritional status of children in resettlement village In Kelantan. Southeast Asian Journal of Tropical Medical Health 1999; 30(1): 122-128.
7. Kikafunda JK, Walker AF, Collet D, James FT. Risk factors for early childhood malnutrition In Uganda. Paediatrics 1988; 102(4): 45.
8. Byrne BM. Structural equation modelling with AMOS: basic concepts, applications and programming. New Jersey, NY: Lawrence Erlbaum Associate; 2001.
9. Sastry N. Community characteristics, individual and household attributes, and child survival in Brazil. Demography 1996; 33(2): 211-230.
10. Tee ES, Mohd IN, Mohd Nasir A, Khatijah I. Nutrient composition of Malaysian foods, 4th Edn. Kuala Lumpur: Institute for Medical Research, 1997.
11. Ministry of Health Malaysia. Recommended nutrient intake (RNI) for Malaysia. A report of the Technical Working Group on Nutritional Guidelines. Kuala Lumpur: National Coordinating Committee on Food and Nutrition, 2005.
12. Anderson, JC, Gerbing, DW. Structural equation modelling in practice: a review and recommended two-step approach. Psychological Bulletin 1988; 103(3): 411-423.
13. Bentler PM, Chou CP. Practical issues in structuring modelling. In: JS Long (ed.). Common problems in quantitative social research. Beverly Hills, CA: Sage 1987; 161-192.
14. Steiger JH. Structural model evaluation and modification: an interval estimation approach. Multivariate Behavioral Research 1990; 25: 173-180.
15. Hu LT, Bentler PM. Cutoff criteria for fit indexes in covariance structure analysis: conventional criteria versus new alternatives. Structural Equation Modelling: A Multidisciplinary Journal 1999; 6: 1-55.
16. Griffiths P, Madise N, Whitworth A, Matthews Z. A tale of two continents: a multilevel comparison of the determinants of child nutritional status from selected African and Indian regions. Health & Place 2004; 10: 183-199.
17. Norhayati M, NoorHayati MI, Mohammod CG, Oothuman P, Azizi O, Fatimah A et al. Malnutrition and its risk factors among children 1-7 years old in rural Malaysian Communities. Asia Pacific Journal of Clinical Nutrition 1997; 6(4): 260-264.
18. Aflah A. Nutritional consequences of food insecurity related to Malnutrition among preschool children in rural households, Tumpat Kelantan, Malaysia. Universiti Sains Malaysia, 2006. (Masters thesis)
19. Garcia EMG, Padron RJA, Ortiz-Hernandez L, Camacho RMM, Vargas OR. Malnutrition effect in the school performance of children. Revista Mexicana de Pediatria2005; 72(3): 117-125.
20. Murni SU, Syahrul HB, Aflah A, Anizar A, Nasarudin NM, Zabidi-Hussin AMH. Risk mapping of malnutrition distribution using remote sensing and geoinformation system (GIS) in Tumpat, North of Kelantan, Malaysia. In, Proceedings, 4th Annual International Conference & Exhibition on Geographical Information Technology & Application (Map Asia 2005); 22-25 August 2005; Jakarta, Indonesia. GIS Development, 2005.
21. Bendley M, Maureen W, Valerie F, Owen L, Lee C. Determinants of childhood malnutrition in Jamaica. Food and Nutrition Bulletin 10(1). (Online) 1988. Available: http://www.unu.edu/unupress/food/8F101e/8F101E08.htm#Determinants (Accessed 1 June 2009).
Abstract
Introduction: Many studies had shown that poor growth in children is associated with malnutrition. The underlying factors are diverse, multisectoral and interrelated, ranging from biological to social, cultural and economically related. Because the highest levels of under-nutrition worldwide are found in South Asia, it is essential that policy-makers in the region understand the underlying determinants, in order to design effective public health intervention programs. This is especially so if public resources are limited, as in rural areas. The purpose of this cross-sectional study was to examine causal relationships among the biological, behavioural and environmental factors related to malnutrition in children aged 5 years and under.
Method: The instrument used in this study was based on a previously described conceptual framework for malnutrition in children, and tested for its psycometric components, using both qualitative and quantitative methods. As well as the use of a questionnaire, anthropometric and dietary data were collected from 295 children aged 5 years and below, randomly selected from clinics in Tumpat, Kelantan. The proposed model was tested and modified using structural equation modelling (AMOS software: ADC, Chicago, IL, USA).
Results: The modified model fitted the data adequately. The results demonstrated that an environmental construct (with factors that included total household income β = 0.68, p <0.01; total expenditure β = 0.67, p <0.01; number of rooms in the house β = 0.46, p <0.01; and socioeconomic status β = 0.71, p <0.01) had a significant effect on malnutrition. Neither the biological nor behavioural constructs had significant effects.
Conclusion: These findings provide useful insights into the importance of environmental factors when designing intervention programs for malnutrition. This information will be useful for the prioritization of preventive programs when resources are limited, especially in a rural setting. Future studies should focus on the ability of households to meet their basic needs, inequality in the population, and the effectiveness of intervention at both micro and macro levels. This study focused on a rural community, therefore the results can only be generalized to areas with similar characteristics.
Key words: causal relationship, children, determinants of malnutrition, structural equation modelling.
You might also be interested in:
2013 - Ophthalmological disorders in rural areas of Crete: a geospatial analysis

