Anthropometric measurements are well established and widely used as indicators of health and nutritional status in both children and adults1. Despite some limitations, anthropometry remains the most practical tool for the assessment of nutritional status among members of the community in developing countries such as India. Body mass index (BMI) is widely accepted as one of the best indicators of nutritional status in adults2. Mid-upper arm circumference (MUAC) is another anthropometric measure used to evaluate adult nutritional status that has been found to be particularly effective in determining malnutrition among adults in developing countries3. It is a simpler measure than BMI, requiring minimum equipment and has been demonstrated to predict morbidity and mortality as accurately as underweight4. An extensive study using data from 8 countries (Mali, India, Senegal, Zimbabwe, Somalia, Ethiopia, Papua New Guinea and China) suggested that MUAC could be used for the simple screening of nutritional status. Being the simplest measure, MUAC has been suggested as a substitute for BMI when the rapid screening of an adult population is required as a prelude to targeting the provision of assistance to those who are undernourished3.
Some studies address mortality and morbidity related to the lower end of BMI values (including chronic energy deficiency [CED]), in the international literature5-7, and from India8-12. Very few studies utilized self-reported morbidity (SRM) data9,10,12,13. Reported loss of work-day/s has also been utilised as a proxy measure of recent illness episodes in relation to low BMI7. The MUAC was shown to be a valuable and simpler alternative to BMI in identification of CED and SRM status in adult male non-tribal slum dwellers in West Bengal, India12, and a MUAC of 240 mm (rather than the conventional 230 mm) has been reported to be the best cut off to identify CED14. But to date there has been no such study among a tribal population in India.
India's Oraon Tribe
India has a tribal population of more than 84 million, representing 8.2% of India's total population15, and this group are reported to be socially and economically disadvantaged16. The Oraon is an agricultural tribe found mainly in Orissa, Bihar, Jharkhand and the West Bengal states of India. They are the second largest tribal community of Jharkhand after the Santals17. The Oraon were originally the inhabitants of the former Chhotanagpur region (East and West Singbhum, Hazaribagh Districts of Jharkhand), which is southwest of the river Ganges. In Jharkhand, they speak Kurukh, which belongs to a sub-group of the Dravidian language. The Oraons have several endogamous totemic clans and they use their clan names as surnames. The land is their main economic resource, and while they are mainly settled cultivators, during unfavourable seasons they depend on forest produce18.
There is a dearth of information on the anthropometric and nutritional status of the adult tribal population of India19. Some recent studies that have called for an urgent evaluation of the nutritional status of the tribes of India have used BMI as the measure of nutritional status20-24. Using the same dataset as in the present study, a high rate of CED among the Oraon males has been reported elsewhere24. The validity and utility of MUAC as a reliable alternative has not yet been tested in these populations.
With these considerations, the present study attempted to evaluate the use of MUAC as a simpler and reliable alternative to BMI, and to suggest a suitable cut-off value for the identification of CED in relation to self-reported illness among the Oraon tribal men of Gumla district of Jharkhand state in India.
The setting
The data used in this cross-sectional study was collected during January 2007 at and around Bishunpur, Gumla District in Jharkhand State, India. Vikash Bharti, a non-government organization (NGO) locally well regarded for its long-term work with tribal people, assisted the researchers, providing a list of Oraon villages in which all families were largely dependent on paddy cultivation. Five long-established, closely located villages accessible by road (Kubatoli, Rehetoli, Bhitar [inner] Serka, Bahir [outer] Serka and Chera) were selected to participate. The villages are approximately 130 km from the state capital, Ranchi. No socio-economic parameter was considered in the selection of the villages.
The subjects and data collection
Due to limited funding it was not possible to employ a trained female field worker to conduct measurements on female subjects, as is essential for this tribal community. Therefore, the study participants were 205 adult Oraon males (>18 years), randomly selected from the populations of the selected villages. A strict sampling strategy was not possible due to difficulties encountered in the field that have been referred to in another work9. All apparently healthy individuals who were able to perform their daily work (self-assessed) were assumed eligible for the study.
The survey was conducted over 3 to 4 days in each village, and each family was informed about the time and date of the survey in advance by local assistants. All males aged over 18 years in each family were invited to participate in the study. The rate of informed participation was approximately 75%.
Information on age, ethnicity, subsistence economy and illness was recorded in a personal interview using a structured questionnaire. Assistance from an interpreter from the Oraon community assured the accuracy of the information collected. The ages of younger men (18-20 years) could be confirmed because most presented birth records. The ages of those older could not be confirmed, but this was cross-checked with other family members and local events and recorded to the nearest year. This did not affect the study because age-variation in anthropometry was not being considered. All participants were cultivators engaged in agricultural labour in the vicinity of their respective villages.
Ethical considerations
The relevant authorities and local community leaders were informed about the objective of the field work, and that data collection was both verbal and written. Because most of the subjects (>98%) were non-literate, verbal informed consent was obtained in their own language prior to each interview and measurement, in the presence of the traditional village headman or his representative. Ethics approval was obtained from the appropriate committees of the first two authors' institutions (Calcuta and Vidyasagar Universities). The conduct of the study followed the guidelines of the Helsinki Declaration25.
Anthropometry and nutritional status
The first author (RC) performed the anthropometric measurements using standard instruments (anthropometer and plastic tape measure) and protocol26. Height and MUAC were recorded to the nearest 1 mm, and 0.5 kg weight, respectively. Technical errors of measurement were computed and found to be within acceptable limits27. The BMI was calculated following standard formula (kg/m2). Nutritional status (NS) was evaluated using both BMI and MUAC. The following cuts-off points were used to identify CED, according to internationally accepted BMI guidelines1:
- CED: BMI <18.5
- non-CED: BMI ≥18.5.
Subjects were also designated undernourished (UN), if they had a MUAC <230 mm.
Morbidity
Self-reported illness history provided each participant's recent history of morbidity9,10,13. Via answers to the structured questions it was established that most of the Oraon participants (98.3%) considered themselves ill only when they were unable to perform their normal daily activities. They remembered an episode of illness only if a work day was lost. Therefore, the measure any working day lost (WDL) during the last 30 days was used, as has been done in other studies7. For the purposes of analysis, data collation used a binary variable with the report of at least one WDL coded '1' and '0' representing a negative report.
Statistical analysis
All statistical analyses were performed using SPSS software v10 (www.spss.com) and significance was p<0.05. Age and anthropometric variables were described by their respective mean, standard deviation, and range value. In all analyses CED and WDL were each coded in the binary categories Yes/ 1 and No/ 0. The frequencies of CED and WDL were expressed as percentages. Chi-square was utilised to test significance of the difference in frequencies of CED and WDL among the MUAC categories.
For the purpose of the analyses, MUAC was also used as the categorical variable and graded according to the following MUAC categories and numerical codes: 1 = ≤220 mm; 2 = 221-239 mm; 3 = 240-259 mm; 4 = ≥260 mm. These categories were constructed with the following intentions:
- One category was created with the lower limit or approximate MUAC cut-off values proposed in this study (243 mm & 239 mm, and rounded to 240 mm).
- The quartile values were rounded to their lower ends.
- Following the first category, intervals were made of approximately 2 cm each.
The first two principles assisted comparison of prevalence rates and of both CED and illness (WDL) at or above the proposed cut-off value of 240 mm. Analysis of variance (ANOVA) was performed to see whether the difference in mean BMI among the MUAC categories was significant. Because age was not found to significantly predict BMI, it was not used as a covariate in ANOVA. Scheffe's post-hoc analysis was used to compare those categories with respect to their mean BMI values. Receiver operating characteristic curve (ROC) analysis was undertaken to locate the optimal cut-off values of MUAC to identify both CED and illness (WDL) efficiently. The ROC analysis was also performed to discover optimal BMI and so identify UN (MUAC <230 mm). Youden index (YI)28 was calculated as: 'sensitivity + specificity - 1'. Among the different MUAC values, YIs were compared to discern the optimal cut-off points for CED and WDL. Multiple logistic regression analysis of WDL (dependent) was run on age (continuous), BMI and MUAC (categorical) to derive adjusted OR for the 3 lower MUAC categories, relative to the highest category. In each case, the highest category was set as reference.
Mean and standard deviation (SD) of age and the anthropometric variables are presented (Table 1). The subjects were aged between 18 and 70 years with a mean (SD) age of 38 (13.4) years. The values for height, weight, BMI and MUAC were 1618 (63) mm, 47.3 (5.3) kg, 18.0 (1.6) and 235 (20) mm, respectively. Subjects' NS (based on BMI and MUAC) is provided (Table 2). The prevalence of CED (BMI <18.5) was 63.9% and under-nutrition (MUAC <230 mm) 35.1%.
The MUAC was significantly positively correlated to BMI (r=.45, p<0.001). The results of the multiple linear regression analysis of BMI on age and MUAC is presented (Table 3), with MUAC found to be a significant predictor of BMI (t=7.122, p<0.01), accounting for 20% of variability in BMI, independent of age (which showed no significant effect on BMI).
Table 1: Characteristics of the study sample (N=205)
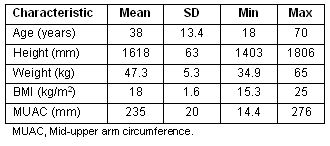
Table 2: Nutritional status of the subjects based on BMI and mid-upper arm circumference

Table 3: Results of multiple regression analysis of BMI on age and mid-upper arm circumference

The results of ROC curve analyses are presented (Table 4), with the sensitivity (SN), specificity (SP), positive predictive value (PPV) and negative predictive value (NPV) for each MUAC value to identify CED (Table 4a). The area under curve (AUC) was 0.79 (p<0.001) (Fig1). A MUAC value of 243 mm was identified as the best cut off to identify CED (BMI <18.5) with SN and SP of 80.2% and 67.6%, respectively. The PPV was 81.4 (CI 73.6-87.7) with the highest NPV 65.8 (CI 54.0-76.3), thus having the highest YI of 0.48. The conventional, international cut off for MUAC (230 mm) for defining UN in adult males had a higher SP (89.2%) but a lower SP (51.9%). The later also fell below 55% at MUAC value greater than 244 mm (eg SP = 51.4% at MUAC 245 mm). When the MUAC cut-off was 243 mm, the rate of under-nutrition (MUAC <243 mm) was found to be 61.5% (Table 2). Similarly, a MUAC value of 239 mm was found to be the cut-off value most likely to identify individuals reporting at least 1 WDL due to illness or 'bad health' (Table 4b) and the AUC was 0.72 (p<0.001) (Fig2). The SN and SP were as high as 75.2% and 64.6%, respectively, and the PPV was 70.7 (CI 61.5-78.8) with the highest NPV of 69.7 (CI 58.9-79.0). It had, thus, the highest YI of 0.40. In another ROC curve analysis (results not shown) of BMI to identify subjects with UN (MUAC <230 mm), it was found that BMI 17.9 was the most efficient (SN 87.5%, SP 66.2%; AUC 0.82, p<0.0001). Another ROC curve analysis (Fig3) was also performed for BMI and WDL (results not shown). In that analysis, BMI 17.5 was found to be the most suitable to identify men's WDL; however, the AUC was less (0.68, p<0.001) than that found for the ROC curve of MUAC (0.72) and the SN was also lower (57%) than that of MUAC (75.2%). The MUAC, therefore, predicted the instances of WDL relatively better than BMI.
Table 4: Results of receiver operating characteristic curve analyses of mid-upper arm circumference with: (a) with chronic energy deficiency status; and (b) illness status (working days lost)
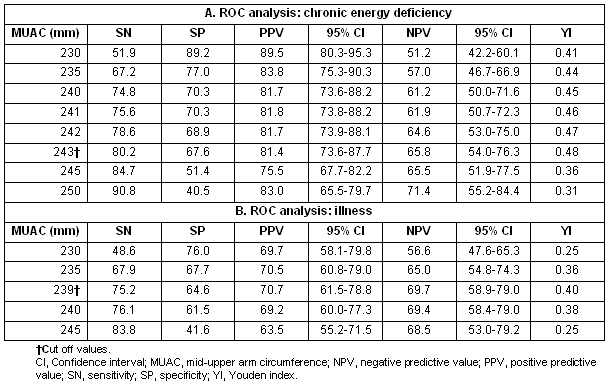
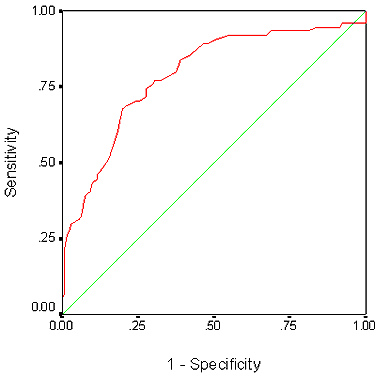
Figure 1: Receiver operating characteristic curve of mid-upper arm circumference and chronic energy deficiency.
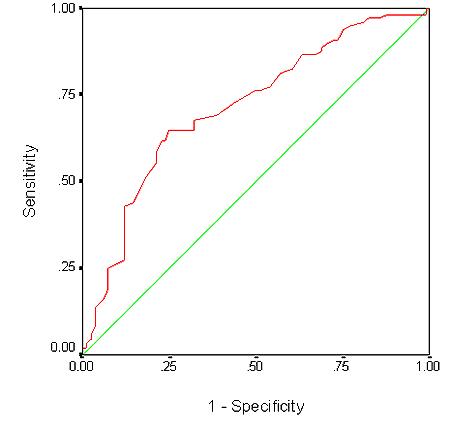
Figure 2: Receiver operating characteristic curve of mid-upper arm circumference and work day lost.
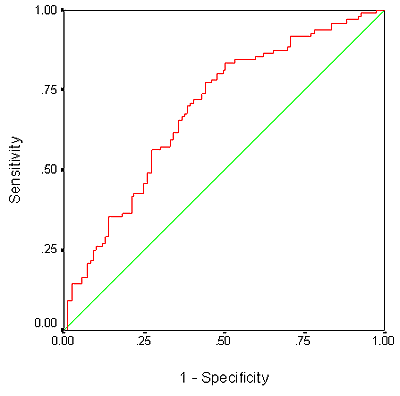
Figure 3: Receiver operating characteristic curve of BMI and working day lost.
Mean (SD) BMI at different levels of MUAC in different MUAC groups is given (Table 5). The mean BMI showed a significant (f=27.33, p<0.001) increase from the lowest MUAC group (17.1) to highest (20.3). Post-hoc analysis of these mean differences revealed that both the lowest and the second lowest MUAC group had significant differences (p<0.001) in mean BMI from both groups 3 and 4; however, the differences were not significant between either groups 1 and 2 or 3 and 4. Therefore BMI increased significantly only when the MUAC value reached a minimum of 240 mm.
The prevalence (%) of CED significantly (χ2=49.10, p<0.001) decreased with the increase in MUAC values. The prevalence of CED was highest (87.2%) in the lowest MUAC group (≤220 mm), and lowest (5.9%) in the highest MUAC group (≥260 mm). There was a very large increase (>8 times) in the CED rate at MUAC less than 260 mm, and a 1.6 times increase below MUAC 240 mm.
The percentage of participants reporting to WDL also significantly (χ2=34.24, p<0.001) increased with a decrease in MUAC. The frequency of reporting WDL was highest in the lowest MUAC group (76.9%), and the lowest in the highest one (23.5%). The frequency increased substantially (>double) at MUAC less than 240 mm. After that the increase in the final (lowest) MUAC group was not as great. In multiple logistic regressions, age was not a significant predictor of WDL. The risk of losing at least a working day was highest in the lowest MUAC group, relative to the highest group (~10 times higher; OR=9.65, p<0.005). It should be noted that the OR did not increase significantly at a MUAC 240-259 mm, from the highest level (≥260 mm). It increased significantly only when MUAC was less than 240 mm.
Table 5: Mean (standard deviation) BMI, prevalence of chronic energy deficiency and working day lost according to mid-upper arm circumference groups

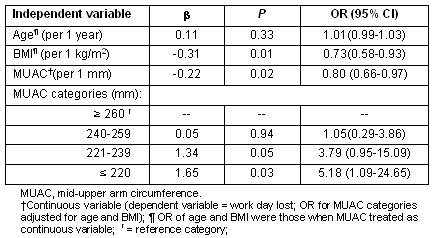
In a further multiple logistic regression, BMI was entered as an explanatory variable additional to age, to test whether MUAC (separately as continuous and as categorical) retained its impact on the risk of WDL (Table 6). Age did not show any significant effect on WDL after allowing for BMI and MUAC; however, there was a significant decrease in both BMI (OR 0.73, p=0.01) and MUAC (OR 0.80, p=0.02), independent of each other, on WDL. Each mm decrease of MUAC significantly reduced the risk of WDL, independent of BMI. When MUAC categories were entered in lieu of its continuous form, the lowest MUAC category (≤220 mm) had more than a 5 times higher risk of losing a working day, compared with the highest category (MUAC ≥260 mm). Interestingly, here also, a MUAC value below 240 mm had approximately 4 times (OR 3.79) higher risk than the highest MUAC category (almost significant at p=0.05). The results indicated that decreased MUAC was a sufficiently suitable indicator of morbidity in terms of WDL.
Table 6: Logistic regression analysis of 'working day lost' on age, BMI and mid-upper arm circumference (separately as continuous and categorised)
Discussion
Limitations
One obvious limitation of the present study was that the data came from one small geographical location. Therefore, before this cut-off point can be recommended for wider use, further validation studies are needed with larger sample sizes and the inclusion of participants' medical history. Another limitation of the present study was the absence of individual subjects' dietary-intake data. In addition, similar studies are needed with female participants to confirm the recommended cut-off point of MUAC of 220 mm3 or determine a more appropriate and efficient cut-off point.
Present results
The determination of an adult population's NS is recognised as of prime importance when assessing for population health and wellbeing. While BMI is most often used for this, MUAC is also recognised as a useful and simpler tool for screening adult individuals for poor nutritional status29 and has been shown to accurately reflect adult NS as defined by BMI30. Further, although MUAC correlates closely with BMI, it is easier to measure and a better predictor of poor health status and morbidity31. In UN populations, MUAC may be better than BMI for screening purposes30, and it has been demonstrated to be an efficient screening technique for the assessment of NS in a variety of ethnic groups32,33.
The present study demonstrated a significant positive correlation between MUAC and BMI. A MUAC value of 243 mm was found to be most appropriate in identification of subjects with CED, and a value of 239 mm was most useful in screening men who were ill in the month before the survey. Both of these values are higher than the internationally recommended men's MUAC cut-off value of 230 mm.
It is known that the distribution of body fat is ethno-specific34. The relationship between overall adiposity (eg measured by BMI) and regional adiposity, measured as body circumferences (waist, MUAC) and skin folds, was also shown to vary according to the population35. Studies have clearly shown significant ethnic differences in regional adiposity and body composition measures (eg % body fat) at the same level of BMI36.
It is generally accepted that a BMI value of less than 18.5 is indicative of CED across ethnic groups1. The MUAC is also recognized as an effective means of screening for poor NS in adults21,29. However, the recommended MUAC cut-off value of 230 mm to define under-nutrition in men3 may not be the most appropriate for all ethnic groups. A study from Nigeria32 reported that a MUAC cut-off point of 230 mm was optimal for the north of the country, while a 240 mm cut-off point was more appropriate for the south. Thus, there is a need to establish ethno-specific MUAC cut-off points.
Similarly, a cut-of point of 240 mm was reported to be suitable in a recent study from the south of India37; however, a recent study15 of non-tribal adult slum dwellers of Bengalee ethnicity in West Bengal, India, reported a MUAC value of 240 mm to be the most appropriate cut-off point for identifying CED (BMI<18.5). A possible reason for cut-off points being higher than that suggested by James et al3 is that persons of South Asian origin (eg the Oraon) have higher levels of regional adiposity (irrespective of BMI) compared with other ethnic groups34-36. Individuals with a MUAC less than 240 mm were approximately twice as likely to report recent illness compared with those with a MUAC equal to or above 240 mm15. In the present study, it was also observed that the frequency of reporting of at least 1 WDL more than doubled at a MUAC below 240 mm, independent of BMI and age. The frequency of CED also reached approximately 80% at the same level. The mean BMI was also lower than the standard level of CED (18.5) and was only 17.5 at the same MUAC level (<240 mm). The lowest level did not show any further significant lowering of BMI. The odds for illness only reached a significant level below MUAC 240 mm, in contrast to the highest level of ≥260 mm. The MUAC category just below 240 mm demonstrated a 6.5 times greater risk of being ill and losing work day/s.
Worth mentioning here are some studies that suggest lowering the BMI cut-off value to 18.5 for determining CED in relation to morbidity and survival7,9. If the value is set close to 16 or 17, the corresponding MUAC cut-off might remain at 230 mm for men, as is now suggested; if not, this MUAC value should be set higher, considering the higher fat content (even subcutaneous) in Asian-Pacific populations. Again in this study, MUAC close to 240 mm was appropriately sensitive to reported illness. However, this study combined with the similar findings discussed, suggests an urgent need to revisit BMI and MUAC cut-off values as the measures of CED and under-nutrition, as is already being done in case of overweight and obesity38.
Conclusion and recommendations
The MUAC cut-off points found in this study for CED and illness were 243 and 239 mm, respectively. Nevertheless, because CED and illness are associated phenomena, it is proposed that a MUAC of close to 240 cm is used as an efficient cut-off point when screening for clinical undernourishment among the adult rural agriculturist Oraon males of Jharkhand, India. Although an increase in BMI had significant reducing effect on illness, independent of a similar effect in MUAC, the latter measure is suggested to be more suitable in limited-resource field situations during a short-term population screening. It is also proposed that further work be undertaken among other tribal groups in India to test conventional cut offs for BMI and MUAC and establish appropriate ethno-specific alternatives. The MUAC is a much simpler measure compared with BMI, requiring no calculations by busy healthcare workers such as nurses, therefore reducing the chances of error31. In this way, use of the preposed revised cut-off point is likely to have large public health implications, especially with respect to primary healthcare related to CED and morbidity.
Acknowledgements
The authors thank Dr S Maiti, Head of the Department of Anthropology, Dinabandhu Mahavidyalaya, Bongaon; Sri Ashoke Bhagat, Secretary, and the staff of Vikash Bharti Bishunpur, Gumla, Jharkhand, India, for their kind support during field work.
References
1. World Health Organization. Physical status: the use and interpretation of anthropometry. Report of a WHO Expert Committee. World Health Organ Technical Report Series. Geneva: WHO, 1995.
2. Khongsdier R, Varte R, Mukherjee N. Excess male chronic energy deficiency among adolescents: a cross-sectional study in the context of patrilineal and matrilineal societies in Northeast India. European Journal of Clinical Nutrition 2005; 59: 1007-1014.
3. James WP, Mascie-Taylor GC, Norgan NG, Bistrian BR, Shetty PS, Ferro-Luzzi A. The value of arm circumference measurements in assessing chronic energy deficiency in Third World adults. European Journal of Clinical Nutrition 1994; 48: 883-894.
4. Briend A, Garenne M, Maire B, Fontaine O, Dieng K. Nutritional status, age and survival: the muscle mass hypothesis. European Journal of Clinical Nutrition 1989; 43: 715-716.
5. James WP, Ferro-Luzzi A, Waterlow JC. Definition of chronic energy deficiency in adults. Report of a Working Party of the International Dietary Energy Consultative Group. European Journal of Clinical Nutrition 1988; 42: 969-981.
6. Harries AD, Laura AJ, Heatley RV, Newcombe RG, Rhodes J. Precision of anthropometric measurements: the value of mid-arm circumference. Clinical Nutrition 1984; 2: 193-196.
7. Pryer J. Body mass index and work disabling and morbidity results from a Banladesy case study. European Journal of Clinical Nutrition 1993; 47: 653-657.
8. Naidu JM, Rao NP. Body mass index: a measure of the nutritional status in Indian population. European Journal of Clinical Nutrition 1994; 48(Suppl3): S131-S140.
9. Khongsdier R. Body mass index and morbidity in adult males of the War Khasi in Northeast India. European Journal of Clinical Nutrition 2002; 56: 484-489.
10. Bose K, Bisai S, Das P, Dikshit S, Pradhan S. Inter-relationships of income, chronic energy deficiency, morbidity and hospitalization among adult male slum dwellers of Midnapore, West Bengal, India. Journal of Biosocial Sciences 2007; 39(5): 779-786.
11. Sauvaget C, Ramadas K, Thomas G, Vinoda J, Thara S, Sankarnarayanan R. Body mass index, weight change and mortality risk in a prospective study in India. International Journal of Epidemiology 2008; 37: 990-1004.
12. Chakraborty R, Bose K. Use of mid-upper arm circumference as a measure of nutritional status and its relationship with self reported morbidity among adult Bengalee male slum dwellers of Kolkata, India. Anthropolgischer Anzeiger 2009; 67(2): 129-137.
13. Strickland SS, Ulijaszek SJ. Body mass index, aging and differential reported morbidity in rural Sawarak. European journal of Clinical Nutrition 1993; 47: 9-19.
14. Chakraborty R, Bose K, Bisai S. Use of Mid-upper arm circumference as a measure of nutritional status and its relationships with self-reported morbidity among the adult Bengalee male slum dwellers of Kolkata, India. In: SJ Ellsworth, RC Schuster (Eds). Appetite and Nutritional Assessment. New York: NOVA Science, 2009; 377-385.
15. Government of India. Census of India. (Online) 2001. Available: http:/www.censusindia.gov.in (Accessed 12 June 2010).
16. Mittal PC, Srivastava S. Diet, nutritional status and food related traditions of Oraon tribes of New Mal (West Bengal), India. Rural and Remote Health 6:385. (Online) 2006. Available: www.rrh.org.au (Accessed 23 August 2011).
17. Datta Banik S, Bose K, Bisai S, Bhattacharya M, Das S, Jana A. Undernutrition among adult Dhimals of Naxalbari, West Bengal: comparison with other tribes of Eastern India. Food and Nutrition Bulletin 2007; 28: 348-352.
18. Mandal H, Mukherjee S, Datta A. India: An illustrated atlas of tribal world. Kolkata: Anthropological Survey of India, 2002.
19. Bose, K, Chakraborty F. Anthropometric characteristics and nutritional status based on body mass index of adult Bathudis: a tribal population of Keonjhar District, Orissa, India. Asia Pacific Journal of Clinical Nutrition 2005; 14: 80-82.
20. Bose K, Banerjee S, Bisai S, Mukhopadhyay A, Bhadra M. Anthropometric profile and chronic energy deficiency among adult Santal tribals of Jhargram, West Bengal, India: comparison with other tribal populations of Eastern India. Ecology of Food and Nutrition 2006; 45: 1-11.
21. Bose K, Ganguli S, Mamtaz H, Mukhopadhyay A, Bhadra M. High prevalence of undernutrition among adult Kora Mudi tribals of Bankura District, West Bengal, India. Anthropological Sciences 2006; 114: 65-68.
22. Bose K, Chakraborty F, Bisai S, Khatun A, Bauri H. Body mass index and nutritional status of adult Savar tribals of Keonjhar District, Orissa, India. Asia Pacific Journal of Public Health 2006; 18: 3-7.
23. Bose K, Chakraborty F, Mitra K, Bisai S. Nutritional status of adult Santal men in Keonjhar District, Orissa, India. Food and Nutrition Bulletin 2006; 27(4): 353-356.
24. Chakraborty R, Bose K. Anthropometric characteristics and nutritional status of adult Oraon men of Gumla District, Jharkhand, India. Internet Journal of Biological Anthropology 2008; 2(1). Available: http://www.ispub.com/ostia/index.php?xmlFilePath=journals/ijba/vol2n1/nutrition.xml (Accessed 23 August 2011).
25. Goodyear MDE, Krleza-Jeric K, Lemmens T. The Declaration of Helsinki. BMJ 2007; 335: 624-625.
26. Lohman TG, Roche AF, Martorell R. Anthropometric standardization reference manual. Chicago, IL: Human Kinetics, 1988.
27. Ulijaszek SJ, Kerr DA. Anthropometric measurement error and the assessment of nutritional status. British Journal of Nutrition 1999; 82: 165-177.
28. Youden WJ. Index for rating diagnostic tests. Cancer 1950; 3: 32-35.
29. Khadivzadeh T. Mid-upper arm and calf circumferences as indicators of nutritional status in women of reproductive age. Eastern and Mediterranean Health Journal 2002; 8: 612-618.
30. Collins S. Using middle upper arm circumference to assess severe adult malnutrition during famine. JAMA 1996; 276: 391-395.
31. Powell-Tuck J, Hennessy EM. A comparison of mid upper arm circumference, body mass index and weight loss as indices of under nutrition in acutely hospitalized patients. Clinical Nutrition 2003; 22: 307-312.
32. Olukoya AA. Identification of underweight women by measurement of the arm circumference. International Journal of Gynecology and Obstetrics 1990; 31: 231-235.
33. Ferro-Luzzi A, James WP. Adult malnutrition: simple assessment techniques for use in emergencies. British Journal of Nutrition 1996; 75(1): 3-10.
34. Bose K. Generalised obesity and regional adiposity in adult White and migrant Muslim males from Pakistan in Peterborough. Journal of Royal Society of Health 1996; 116: 161-167.
35. Bose K. The interaction of waist-hip ratio and conicity index with subcutaneous adiposity in two ethnic groups: native British and migrant Pakistani men. Anthropolgischer Anzeiger 2001; 59(3): 275-282.
36. Deurenberg P, Yap M, van Staveren WA. Body mass index and percent body fat: a meta- analysis among different ethnic groups. International Journal of Obesity Related Metabolic Disorder 1998; 22(12): 1164-1171.
37. Rodrigues VC, Rao RS, Lena A. Utility of arm circumference as a screening instrument to identify women at nutritional risk. Tropical Doctor 1994; 24: 164-166.
38. WHO, WHO Expert Consultation. Appropriate body mass index for Asian populations and its implications for policy and intervention strategies. The Lancet 2004; 363: 157-163.


