Inequalities in healthcare outcomes exist and have been associated with race, socioeconomic status (SES), age, education, insurance and geography1-4. Patients living in rural areas have decreased access to health care and poorer health status when compared to their urban counterparts5. Geographic location, in particular rural residence, negatively affects healthcare outcomes for those with diabetes, dementia, cardiovascular disease and psychiatric disease5-10. These inequalities are most profound for rural African-Americans5,11.
Rural healthcare inequalities in cancer are less clear. Rural regions have diminished access to and use of cancer screening; this may be related to the distance to screening facilities12-14. Rural patients also have decreased access to cancer centers, academic medical centers, medical oncologists and other cancer-related services7,11,15-17. While some research indicates rural residents are more likely to present with advanced disease, other studies indicate the contrary to be true17-24.
The effects of population density on outcomes, such as incidence, stage and survival for colorectal cancer (CRC) outcomes, is also unclear. Although some have found distances from primary care provider and rural residence to be associated with a later stage of presentation for CRC, others have found urban patients more likely to present with metastatic disease14,20,24,25. Investigators also have demonstrated higher mortality rates in urban patients18,22,26. These studies are limited by factors such as dichotomous definition of population density (ie urban vs non-urban, rural vs urban), omission of socioeconomic data, no multivariate analysis, or lack of patient diversity. Given the discrepancies in CRC stage at presentation and survival in relationship to population density along with the limitation in the present literature, the present study sought to better define these relationships in a large, national tumor registry.
Data extraction
Data were extracted from the National Cancer Institute Surveillance, Epidemiology and End Results (SEER) Registries, which collects data from 17 population-based cancer registries representing approximately 26% of the US population. The dataset was assembled with the Case Listing function in SEER*Stat software v6.6.2 (Surveillance Research Program, National Cancer Institute; http://seer.cancer.gov/seerstat). Incident cases were enrolled if they met the following criteria: age at diagnosis ≥40 years, diagnosis from 1992 to 2002, and site of cancer colon or rectum. Data were assembled up to 2002 to allow sufficient follow-up time to establish long-term outcomes. Cases were excluded if not malignant or age was unknown. The following variables were included: age at diagnosis, race, sex, year of diagnosis, stage, primary site of disease, survival in months, and vital status (alive or dead). Additional county level variables were obtained from SEER*Stat County Attributes 2000s function and included percentage of patients with less than a high school education, median family income, percentage of families below the poverty line, percentage of persons unemployed, and percentage 'white collar'. The definition of 'white collar', according to Webster's Dictionary (10th edn), is 'of, relating to, or having the kind of jobs that are done in an office instead of a factory, warehouse, etc.'.
Outcome variables
SEER*Stat v6.6.2 provides a year 2000 county urban-rural continuum. Counties are defined in SEER as metropolitan (1: >1 000 000; 2: >250 000 and <1 000 000; 3: <250 000), urban (1: >20 000 adjacent to metropolitan area; 2: >20 000 not adjacent to metropolitan area; 3: 2500-19 999 adjacent to metropolitan; 4: 2500-19 999 not adjacent to a metropolitan area) or rural (1: <2500 adjacent to a metropolitan area; 2: <2500 not adjacent to a metropolitan area).
Data analysis
In order to simplify the urban-rural continuum schema, county population categories were condensed into the following categories: large metropolitan (>1 000 000), metropolitan (250 000-1 000 000), urban (20 000-250 000), small urban (2500-20 000) and rural (<2500). Socioeconomic status was defined using a modification of an index originally reported by Robert et al.; this index has been used to estimate county level SES in other large data sets27,28. The SES index was constructed with variables available in the SEER Registries. Three domains were defined with county-level data: education (percentage of high school graduates), income (median income and percentage below the poverty line) and employment (percentage unemployed and percentage white collar). Each factor was divided into quintiles, with 1 reflecting the lowest SES quintile. The overall SES index was derived by summing scores from the aforementioned data points and again subdividing into quintiles to derive a score from 1 to 5.
Statistical analysis was performed with the Statistical Package for the Social Sciences (SPSS; http://www.spss.com); bivariate comparisons were made with χ2 and student's t-test, median overall survival was calculated by log-rank method, and multivariate analysis performed with logistic and Cox regression. Statistical significance was defined as p<0.05.
The final study population consisted of 176 011 patients, with 36.4% from the California SEER Registry. Cancers were distributed in all parts of the colon and rectum including sigmoid colon (22%), cecum (18%), rectum (19%), ascending colon (12%), rectosigmoid junction (9%), transverse colon (7%), descending colon (4%), hepatic flexure (4%), splenic flexure (4%), and 'not otherwise specified' (2%). At the time of analysis, 36% of patients were alive, 38% died of CRC and 26% were recorded as dying from other causes.
Demographics
The median age of presentation was 71 years (mean age 69.2 years). As shown in Table 1, a majority of patients were classified as white with non-metastatic disease, and gender was evenly distributed. A large percentage of patients (63.2%) were from counties classified as large metropolitan.
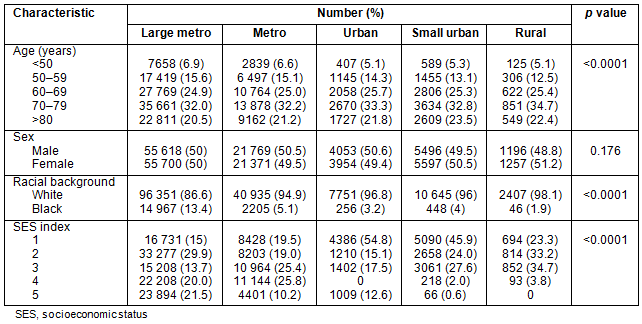
Table 2 outlines patient demographics along the urban-rural continuum. Urban and rural counties have slightly more patients >70 years old. Patients in large metropolitan counties had a greater number of African-Americans, and the number of African-Americans decreased almost linearly as county population decreased. Counties with smaller population had higher proportions of individuals in the lowest SES quintiles.
Table 1: Demographics and county level data for patients
diagnosed with colorectal cancer, SEER 17 Registries, 1992-2002
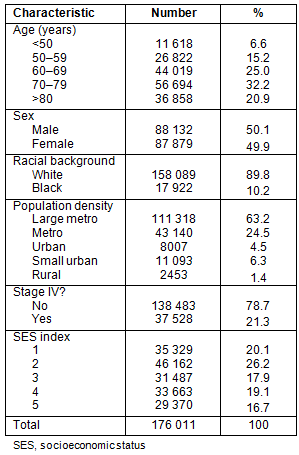
Table 2: Demographic characteristics along an urban-rural continuum for
patients (%) diagnosed with colorectal cancer, SEER 17 Registries, 1992-2002
Stage and survival analysis
Stage IV: Presentation with metastatic disease is outlined in Table 3. Patients from metropolitan counties with a population <1 million presented less frequently with metastatic disease. African-Americans had higher rates of metastatic disease than their white counterparts: 26.2% and 20.8%, respectively. Patients in the groups reflecting the extremes of age (<50 years and >80 years) had slightly higher rates of stage IV disease, as did men and patients residing in counties in the lowest SES quintiles.
Survival analysis
U- or J-shaped survival associated with county population: Overall median survival was 84 months. Those residing in metropolitan counties with <1 million people had a statistically and clinically significant survival advantage relative to all other counties, 11 months greater than those in rural counties (Fig1a). There was a non-linear relationship between median survival and county population (Fig2).
Other factors associated with survival: African-Americans had a significant survival disadvantage when compared to whites: 65 versus 86 months (Fig1c). Nearly linear decrease in survival was noted with lower county-level SES, with a 13-month survival disadvantage when the highest and lowest SES counties were contrasted (Fig1b). Men and women had similar survival: 83 versus 85 months (p=0.176).
Table 3: Univarate analysis of likelihood to present
with stage IV colorectal cancer, SEER 17 Registries, 1992-2002
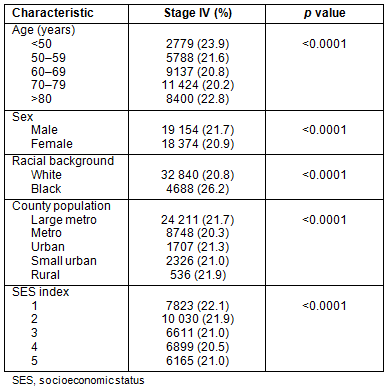
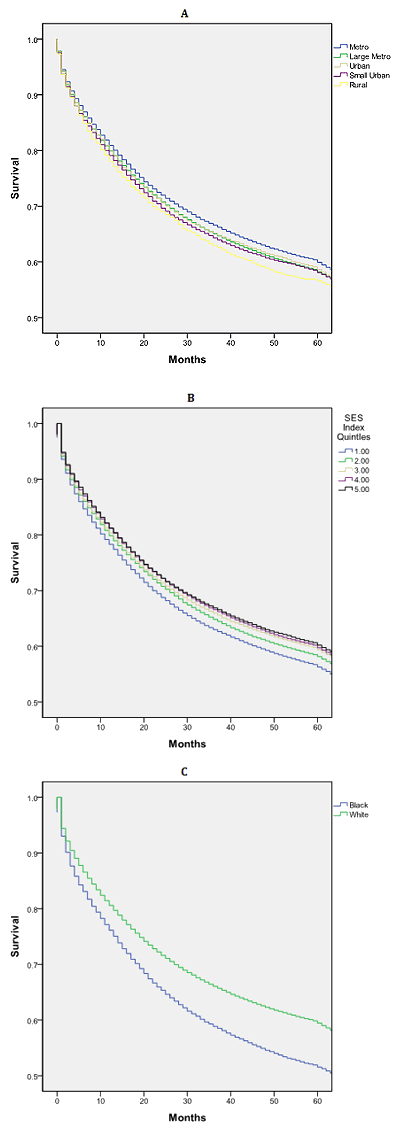
Figure 1: Kaplan-Meier survival curves (log-rank) for patients with
colorectal cancer by (A) county population, (B) socioeconomic
status Index and (C) race, SEER 17 Registries, 2002-2007.
Multivariate analysis
Stage: Table 4 shows the results of a multivariate logistic regression analysis of stage at presentation. Data presented are adjusted odds ratio estimates (adjusted for the other factors in the model) along with confidence intervals and p values. For each factor in the model, a referent was selected and odds ratio estimates are presented in terms of the increase (or decrease) in odds versus the referent. The lowest county SES was associated with an increased odds of stage IV disease and African-Americans had higher odds of presenting with metastatic disease, odds ratio (OR) 1.327 (p<0.0001). Using metropolitan counties with population <1 million as referent, patients in larger metropolitan counties had slightly higher odds of presenting with metastatic disease (adjusted OR 1.067 and p<0.0001). No other significant relationships were evident between county population and stage.
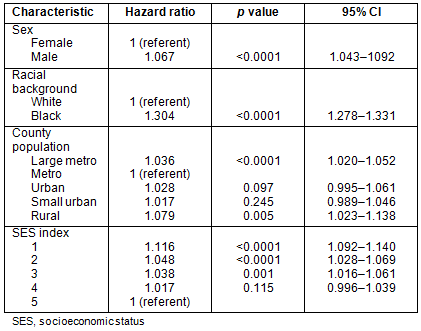
Survival: Patients residing in large metropolitan and rural counties had diminished survival when compared to those residing in metropolitan counties with populations <1 million (Table 5). These differences are modest, but do persist when controlling for age, sex, race and SES index. African-Americans had a significant survival disadvantage compared to whites, with a hazard ratio of 1.304 (p<0.0001). Survival time is diminished for those residing in the lowest SES index counties.
Table 4: Multivariate analysis: Likelihood of presenting with
stage IV colorectal cancer (binary regression), SEER 17 Registries, 1992-2002
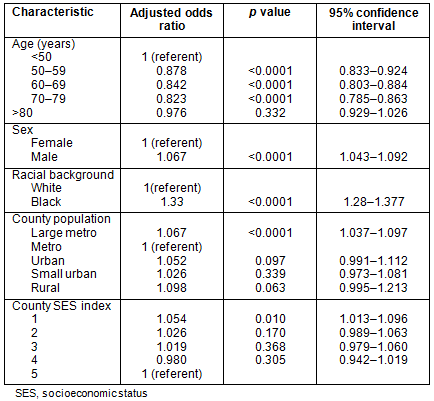
Table 5: Multivariate analysis: Survival analysis (Cox regression)
of colorectal cancer patients, SEER 17 Registries, 1992-2002
Discussion
These data demonstrate that outcome inequalities exist for patients with colorectal cancer. Using data from the SEER Registries, a complex interaction between county population and CRC stage of presentation and survival was found. Patients residing in metropolitan counties with a population <1 000 000 had lower rates of advanced disease and longer median survival when compared to their counterparts in large metropolitan (>1 000 000) and less-populated counties. This was true for both unadjusted and multivariate analyses. A significant disadvantage for African-Americans compared with white patients was also revealed. Additionally, men had a slight disadvantage, as did patients residing in counties of lower SES.
Studies reporting the influence of population density on CRC outcomes have been inconsistent. Colon cancer patients in the rural south-east have been noted to present at a later stage and have a decreased survival23,24. In contrast, using SEER data investigators have found patients in urban regions with lung cancer and CRCs to be more likely to present with metastatic disease20. Such studies often report populations on a dichotomous scale22,26. Such a dichotomous division may mask more subtle urban and rural inequalities17,21,29. For example, suburban patients are much more likely to receive chemotherapy than are their urban or rural counterparts11. There may also be variations across regions and ethnic/racial groups, like those in the predominantly black rural south compared to the predominantly white rural north-east/mid-west.
The relationship between stage at diagnosis and population is more complex than a simple dichotomous division could explain. In this study it was found that patients in metropolitan counties with a population <1 000 000 tended to present with earlier stage disease than those from counties with larger or smaller populations. Multivariate analysis that controlled for age, sex, race, gender, and SES revealed that this relationship, although diminished, persisted.
Others have found a similar relationship between population and stage at presentation. McLafferty and Wang examined data from Illinois on stage of presentation of breast, lung, prostate and CRC reporting a J-shaped relationship between population density and stage at presentation21. Patients from Chicago and rural areas (less than 10 000 people per county) fared worse than those in suburbs, other metropolitan areas and large towns. Similarly, in a study of patients in Nebraska, those residing in micropolitan counties (non-metropolitan regions with populations of 10 000-49 999) were less likely to present with metastatic disease when compared to metropolitan and rural patients17.
A similar, but more robust, non-liner relationship exists between survival and county population (Fig2). These data demonstrate median survival was greatest for patients residing in metropolitan counties with populations <1 million while rural patients had a shorter survival than all other counties (Fig2). Other authors have reported a similar relationship between survival and population. Hawley et al. reported a U-shaped curve describing the relationship between incidence and mortality for patients with colorectal cancer in Texas, with worse outcomes in very rural and very urban populations29. Interestingly, when they viewed the data on a dichotomous scale, urban patients fared worse than their non-urban counterparts, and the influence of rurality was in effect obscured. They concluded, as the present authors have, that a dichotomous definition of urban versus rural is inadequate for understanding the influences of population on cancer outcomes. In a study constructed similarly to the present study's data but limited to the Georgia SEER Registry, Hines and Markossian found rural residents were not more likely to present with distant disease but had an increased risk of death compared to urban patients30. However, they did not include regions of intermediate population density.
African-Americans have poorer outcomes for colorectal cancer; there is also a clear survival disadvantage for African-American patients for almost all cancers31,32. The present study found that African-Americans with CRC had higher rates of metastatic disease (26.6 vs 20.8%, OR 1.33) and lower survival (65 vs 86 months, OR 1.32; Fig1c) compared to their white counterparts. Inadequate access to and delivery of care to racial and ethnic minorities have been cited as the primary factors resulting in cancer inequalities33-38. However, differences in tumor biology may also account for some racial inequalities37,38. There is a clear association reported between SES and outcomes for patients with colorectal cancer. Regions with area-level socioeconomic depravation have a greater risk for advanced stage and death from CRC1,34,39-41. The present analysis corroborates these findings. One must be mindful that race information is often based on medical records and can be biased by factors such as admission staff, patient surname, birthplace, maiden name, local population, or other factors42.
The variable effect of rurality on cancer outcomes may be, in part, secondary to heterogeneity between regions. These data demonstrate that outcome inequalities are driven by county population, race, gender, age, and SES, with race being the strongest predictor of poor outcome. The study found that rural patients in this SEER dataset were of low SES but more likely to be white than patients in large metropolitan counties. Much of the rural healthcare disparity previously reported described predominately poor African-American populations5. Given that race is such a strong predictor of outcome in CRC, it would be expected that rural patients in datasets such as the SEER Registries (primarily white) would differ from those for other rural populations, such as the south-east (with a higher proportion of African-Americans).
This study has several limitations. First and foremost, this is a retrospective cohort study using a large administrative data set with the inherent limitations of such research. Additionally, census data is used to derive not only population but also socioeconomic factors. As such, these data may not accurately reflect the status of individual patients27. Given this, an individual patient or groups of patients may have a lower or higher SES than the county-level data. Unfortunately, SEER does not provide patient-level SES data. Although the SEER Registries represents 26% of the US population, it is not entirely representative, ie more than a third of the patients in the SEER Registries are from California. Finally, large data sets allow small statistically significant relationships to be defined that may not have clinical relevance.
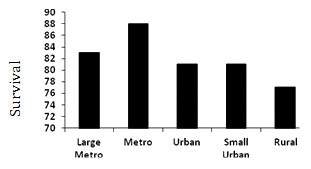
Figure 2: Median survival (months) by county population for
patients with colorectal cancer, SEER 17 Registries, 1992-2002.
A non-linear relationship exists between county population and CRC outcomes. Patients in rural and large metropolitan counties are more likely to present with advanced CRC and have a diminished survival. While the etiology of these differences is still unclear, it may be related to factors such as access to care, differing models of healthcare delivery or other less well defined social/economic barriers. In addition to population, race and SES drive health outcome inequalities in CRC patients. As the SEER Registries report only county-level SES factors, additional studies with patient-specific SES data would more clearly define this relationship. African-American race is the strongest predictor of a poor outcome. It is likely that in order to rectify health inequalities, strategies that take into account both geographic and other population variables will be required.
References
1. Fitzgerald TL, Bradley CJ, Dahman B, Zervos EE. Gastrointestinal malignancies: when does race matter? Journal of the American College of Surgeons 2009; 209(5): 645-652.
2. Freeman J, Boomer L, Fursevich D, Feliz A. Ethnicity and insurance status affect health disparities in patients with gallstone disease. Journal of Surgical Research 2011; 165(2): 176.
3. Sabik LM, Dahman BA. Trends in care for uninsured adults and disparities in care by insurance status. Medical Care Research and Review 2012; 69(2): 215-230.
4. Joynt KE, Harris Y, Orav EJ, Jha AK. Quality of care and patient outcomes in critical access rural hospitals. Journal of the American Medical Association 2011; 306(1): 45-52.
5. Erwin PC, Fitzhugh EC, Brown KC, Looney S, Forde T. Health disparities in rural areas: the interaction of race, socioeconomic status, and geography. Journal of Health Care for the Poor and Underserved 2010; 21(3): 931-945.
6. Paquette IM, Zuckerman R, Finlayson SR. Perforated appendicitis among rural and urban patients: implications of access to care. Annals of Surgery 2011; 253(3): 534-538.
7. Burris JL, Andrykowski M. Disparities in mental health between rural and nonrural cancer survivors: a preliminary study. Psychooncology 2010; 19(6): 637-645.
8. Hale NL, Bennett KJ, Probst JC. Diabetes care and outcomes: disparities across rural America. Journal of Community Health 2010; 35(4): 365-374.
9. Thorpe JM, Van Houtven CH, Sleath BL, Thorpe CT. Rural-urban differences in preventable hospitalizations among community-dwelling veterans with dementia. Journal of Rural Health 2010; 26(2): 146-155.
10. Petterson S, Williams IC, Hauenstein EJ, Rovnyak V, Merwin E. Race and ethnicity and rural mental health treatment. Journal of Health Care for the Poor and Underserved 2009; 20(3): 662-677.
11. Hao Y, Landrine H, Jemal A, Ward KC, Bayakly AR, Young JL, Jr., et al. Race, neighbourhood characteristics and disparities in chemotherapy for colorectal cancer. Journal of Epidemiology and Community Health 2011; 65(3): 211-217.
12. Jackson MC, Davis WW, Waldron W, McNeel TS, Pfeiffer R, Breen N. Impact of geography on mammography use in California. Cancer Causes and Control 2009; 20(8): 1339-1353.
13. Doescher MP, Jackson JE. Trends in cervical and breast cancer screening practices among women in rural and urban areas of the United States. Journal of Public Health Management and Practice 2009; 15(3): 200-209.
14. Parsons MA, Askland KD. Cancer of the colorectum in Maine, 1995-1998: determinants of stage at diagnosis in a rural state. Journal of Rural Health 2007; 23(1): 25-32.
15. Onega T, Duell EJ, Shi X, Wang D, Demidenko E, Goodman D. Geographic access to cancer care in the U.S. Cancer 2008; 112(4): 909-918.
16. Onega T, Duell EJ, Shi X, Demidenko E, Goodman D. Influence of place of residence in access to specialized cancer care for African Americans. Journal of Rural Health 2010; 26(1): 12-19.
17. Sankaranarayanan J, Watanabe-Galloway S, Sun J, Qiu F, Boilesen E, Thorson AG. Rurality and other determinants of early colorectal cancer diagnosis in Nebraska: a 6-year cancer registry study, 1998-2003. Journal of Rural Health 2009; 25(4): 358-365.
18. Chirumbole M, Gusani N, Howard A, Leonard T, Lewis P, Muscat J. A comparison of stage of presentation for pancreatic and colorectal cancer in Pennsylvania 2000-2005. Anticancer Research 2009; 29(8): 3427-3431.
19. Coughlin SS, Richards TB, Thompson T, Miller BA, VanEenwyk J, Goodman MT, et al. Rural/nonrural differences in colorectal cancer incidence in the United States, 1998-2001. Cancer 2006; 107(5 Suppl): 1181-1188.
20. Paquette I, Finlayson SR. Rural versus urban colorectal and lung cancer patients: differences in stage at presentation. Journal of the American College of Surgeons 2007; 205(5): 636-641.
21. McLafferty S, Wang F. Rural reversal? Rural-urban disparities in late-stage cancer risk in Illinois. Cancer 2009; 115(12): 2755-2764.
22. Monroe AC, Ricketts TC, Savitz LA. Cancer in rural versus urban populations: a review. Journal of Rural Health 1992; 8(3): 212-220.
23. Liff JM, Chow WH, Greenberg RS. Rural-urban differences in stage at diagnosis. Possible relationship to cancer screening. Cancer 1991; 67(5): 1454-1459.
24. Snyder JW, Foley KL. Disparities in colorectal cancer stage of diagnosis among Medicaid-insured residents of North Carolina. North Carolina Medical Journal 2010; 71(3): 206-212.
25. Kinney AY, Harrell J, Slattery M, Martin C, Sandler RS. Rural-urban differences in colon cancer risk in blacks and whites: the North Carolina Colon Cancer Study. Journal of Rural Health 2006; 22(2): 124-130.
26. Nasca PC, Burnett WS, Greenwald P, Brennan K, Wolfgang P, Carlton K. Population density as an indicator of urban-rural differences in cancer incidence, upstate New York, 1968-1972. American Journal of Epidemiology 1980; 112(3): 362-375.
27. Robert SA, Strombom I, Trentham-Dietz A, Hampton JM, McElroy JA, Newcomb PA, et al. Socioeconomic risk factors for breast cancer: distinguishing individual- and community-level effects. Epidemiology 2004; 15(4): 442-450.
28. Du XL, Fang S, Coker AL, Sanderson M, Aragaki C, Cormier JN, et al. Racial disparity and socioeconomic status in association with survival in older men with local/regional stage prostate carcinoma: findings from a large community-based cohort. Cancer 2006; 106(6): 1276-1285.
29. Hawley ST, Chang S, Risser D, Zhang Q. Colorectal cancer incidence and mortality in Texas 1990-1992: a comparison of rural classifications. Journal of Rural Health 2002; 18(4): 536-546.
30. Hines RB, Markossian TW. Differences in late-stage diagnosis, treatment, and colorectal cancer-related death between rural and urban African Americans and whites in Georgia. Journal of Rural Health 2012; 28(3): 296-305.
31. Virnig BA, Baxter NN, Habermann EB, Feldman RD, Bradley CJ. A matter of race: early-versus late-stage cancer diagnosis. Health Affairs (Millwood) 2009; 28(1): 160-168.
32. Albain KS, Unger JM, Crowley JJ, Coltman CA, Jr., Hershman DL. Racial disparities in cancer survival among randomized clinical trials patients of the Southwest Oncology Group. Journal of the National Cancer Institute 2009; 101(14): 984-992.
33. Steyerberg EW, Earle CC, Neville BA, Weeks JC. Racial differences in surgical evaluation, treatment, and outcome of locoregional esophageal cancer: a population-based analysis of elderly patients. Journal of Clinical Oncology 2005; 23(3): 510-517.
34. Du XL, Meyer TE, Franzini L. Meta-analysis of racial disparities in survival in association with socioeconomic status among men and women with colon cancer. Cancer 2007; 109(11): 2161-2170.
35. Ananthakrishnan AN, Schellhase KG, Sparapani RA, Laud PW, Neuner JM. Disparities in colon cancer screening in the Medicare population. Archives of Internal Medicine 2007; 167(3): 258-264.
36. Shokar NK, Carlson CA, Weller SC. Prevalence of colorectal cancer testing and screening in a multiethnic primary care population. Journal of Community Health 2007; 32(5): 311-323.
37. Fejerman L, Ziv E. Population differences in breast cancer severity. Pharmacogenomics 2008; 9(3): 323-333.
38. Demicheli R, Retsky MW, Hrushesky WJ, Baum M, Gukas ID, Jatoi I. Racial disparities in breast cancer outcome: insights into host-tumor interactions. Cancer 2007; 110(9): 1880-1888.
39. Lian M, Schootman M, Doubeni CA, Park Y, Major JM, Torres Stone RA, et al. Geographic variation in colorectal cancer survival and the role of small-area socioeconomic deprivation: a multilevel survival analysis of the NIH-AARP Diet and Health Study Cohort. American Journal of Epidemiology 2011; 174(7): 828-838.
40. Henry KA, Niu X, Boscoe FP. Geographic disparities in colorectal cancer survival. International Journal of Health Geographics 2009; 8: 48.
41. Niu X, Pawlish KS, Roche LM. Cancer survival disparities by race/ethnicity and socioeconomic status in New Jersey. Journal of Health Care for the Poor and Underserved 2010; 21(1): 144-160.
42. Risser DR, Morky B, Bowcock C, Miller EA, Williams MA, Magid R, et al. Colorectal cancer in Texas, 2010. Austin, TX: Texas Cancer Registry, Texas Department of State Health Services; Cancer Prevention Research Institute of Texas, November, 2010.
