Introduction
Despite well-known health benefits of physical activity (PA), ongoing concern exists in the USA that the adult population does not engage in regular PA or meet the recommended guidelines for aerobic and muscle-strengthening exercise1-3. A recent national call to action to improve PA cited environmental factors as a key strategic focus4, and researchers have observed significant associations between PA and community environments (eg access to facilities) for decades5. As this area of inquiry has matured, scholars from diverse fields have produced an amalgam of intersecting PA research on objective and subjective measures of the built environment6-8, linking PA to perceived environmental supports9-12. However, these objective (eg distance to a facility) and subjective (eg quality of sidewalk maintenance) measures do not always correlate, nor are they necessarily associated with the same PA outcomes13,14. Moreover, the locality (eg urban versus rural) of PA appears to attenuate the strength of such associations15. This latter discovery is particularly meaningful because people living in rural areas tend to be less physically active than those living in urban areas16,17. As part of ongoing research in this area, Umstattd et al developed the Rural Active Living Perceived Environmental Support Scale (RALPESS), for which continued investigation, particularly among diverse populations, is warranted18.
Because a substantial portion (20.5%) of a diverse group of people known as the American Indians live in federally defined rural areas19, authors of the present study identified American Indians as an important population with which to continue work using the RALPESS. Rural American Indians (RAIs) are shown to be disproportionately affected by cardiovascular disease, diabetes, and stroke and are at elevated risk for being overweight and obese due to physical inactivity20,21. Despite the significant health disparities faced by this population, studies have identified a paucity of research on PA in RAI populations22. To address this gap, the present study measures the construct validity of the RALPESS in a predominant RAI sample, while simultaneously addressing three important aims: (1) heeds the call for continued work with the RALPESS in diverse populations, (2) generates additional research on PA among RAI, and (3) adds to the body of literature on environmental supports for rural PA.
Methods
The RALPESS instrument
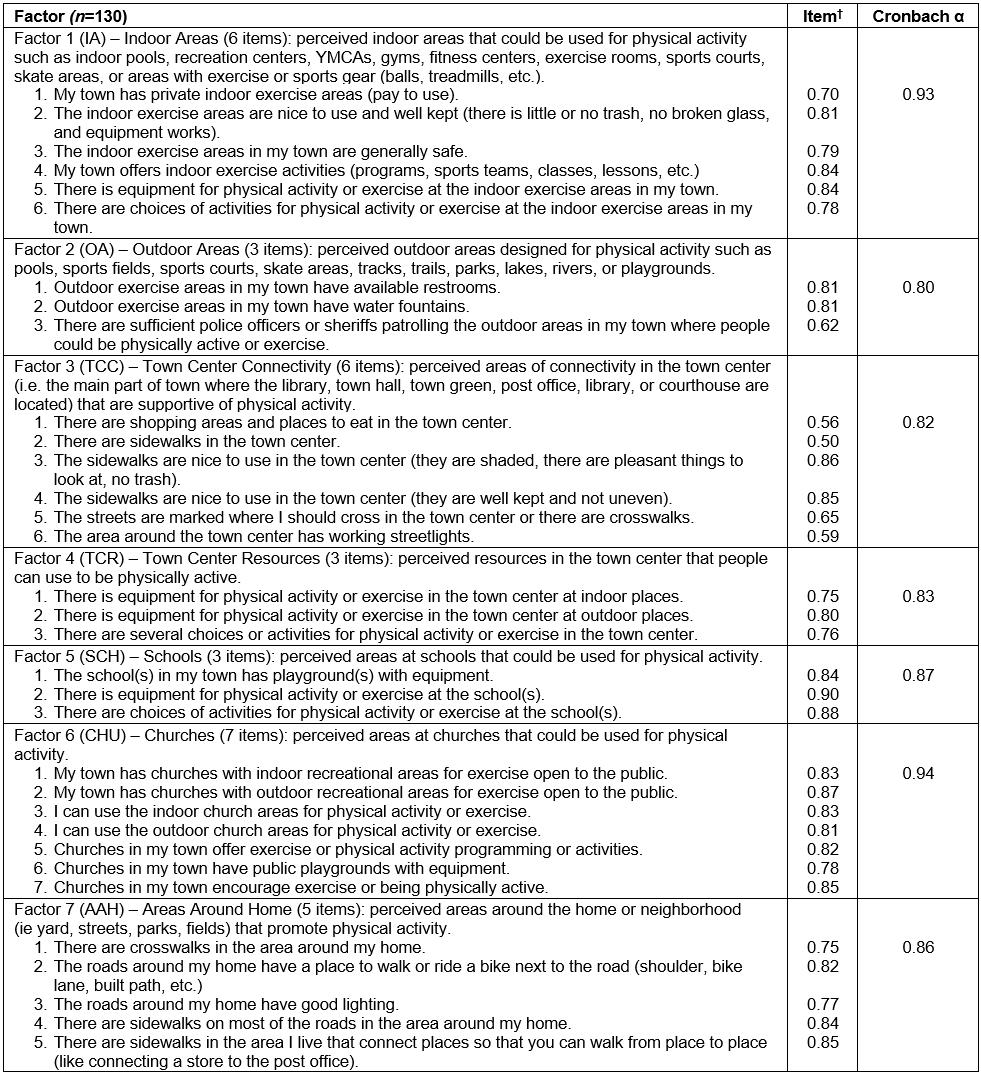
The RALPESS instrument was originally created by Umstattd et al to measure perceived environmental supports for PA using four-point Likert-type scales (‘strongly disagree’ to ‘strongly agree’)18. In their development study, following expert panel review and field testing, the RALPESS was subjected to a principal component analysis (PCA) with varimax rotation to identify latent factors18. The PCA supported a seven-factor solution consisting of indoor areas (IAs; items 1–6), outdoor areas (OAs; items 7–9), town center connectivity (TCC; items 10–15), town center resources (TCRs; items 16–18), school grounds (SCHs; items 19–21), church facilities (CHUs; items 22–28), and areas around the home or neighborhood (AAHs; items 29–33). Each factor was explained by at least three items, and together the seven factors accounted for 71.62% of the variance, with good subscale consistency18. The final 33-item instrument developed by that research team, along with factor definitions and item descriptions, is presented in Table 1.
Table 1: Confirmatory Structure of the seven-factor (33-item) Rural Active Living Perceived Environmental Support Scale with definitions, item-loadings and internal consistency
Sampling and recruitment
For the present study, participants were conveniently recruited from local events hosted by partners of a tribal Head Start program in rural Oklahoma during the months of March to May of 2013. The final sample consisted of adults (n=130) aged 18 years or more who consented to take part in the study and who completed the RALPESS instrument in paper and pencil format. The self-reported biometrics of weight and height were used to calculate participants’ body mass index (BMI) during the single administration period. No incentives were provided for study participation.
Data analysis
To test for construct validity, unidimensionality, and reliability of the 33-item hypothesized factor structure23, data collected were entered in the Statistical Package for the Social Sciences v22 (IBM; http://www.spss.com) for confirmatory factor analysis using the AMOS module. Descriptive statistics were assessed for problematic patterns by checking for out-of-range values, univariate outliers, and reviewing likelihood of means and standard deviations. No participant had greater than 5% missing data.
Ethics approval
The University of Mississippi Institutional Review Board (protocol no. 07-101) approved all recruitment and data collection prior to the study.
Results
Sample
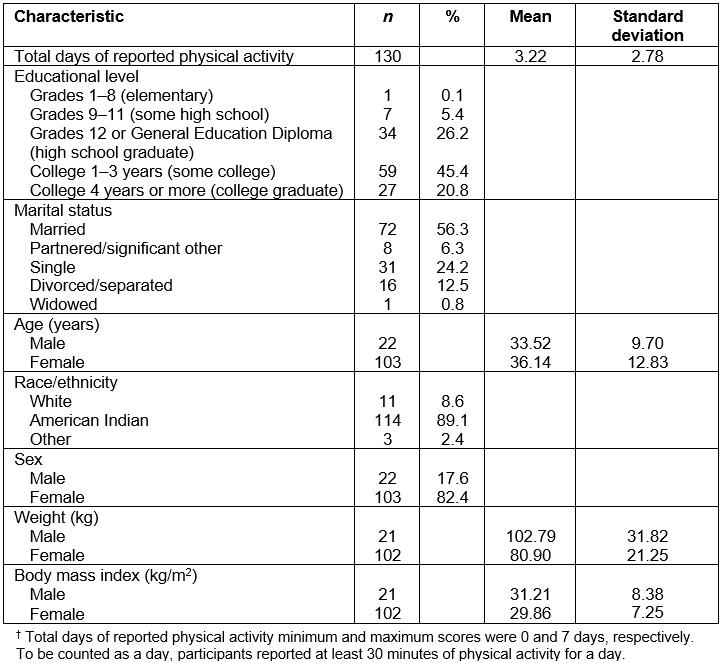
The sample, described in greater detail in Table 2, predominantly was American Indian (89.1%) and consisted of more females (82.4%) than males (17.6%); most (86.4%) males were American Indian. The average number of total days of regular exercise, a measure of PA engagement for at least 30 minutes per day over 1 week, was 3.22 (standard deviation (SD)=2.78). The average weight for females was 80.90 kg (SD=21.25) with a BMI of 29.86 (SD=7.25), which bordered criteria set for overweight (BMI=25.0–29.9) and obese (BMI≥30.0) based on national guidelines24. Using the same criteria24, the average weight for males was 102.79 kg (SD=31.82) with a BMI of 31.21 (SD=8.38), which meant most men in the sample were obese.
Table 2: Sample characteristics†
Statistical analysis
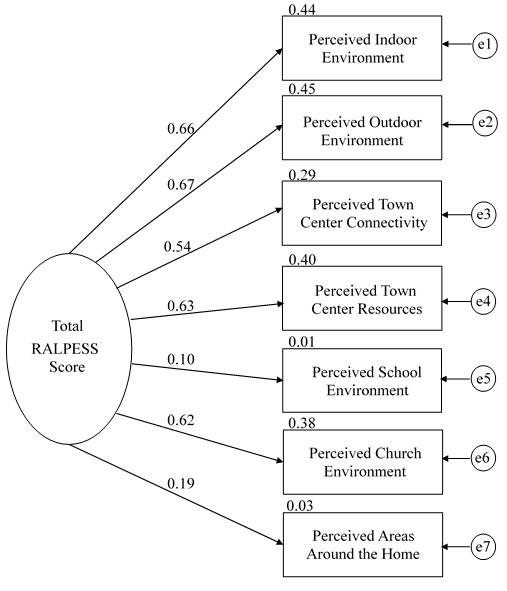
Analytic criteria: Using the established seven-factor solution18, the RALPESS was subjected to confirmatory factor analysis, where latent variables were allowed to correlate, and all items were modeled to load on their corresponding factors (Fig1). Regression weights, expected parameters of change, and modification indices received examination for areas of model misfit. Model appropriateness was tested against standards established by Stevens25 and Byrne26. Item-to-factor loadings were examined at ≥0.40 specified at the p<0.01 level that resulted in a reasonable, non-significant χ2 goodness of fit index (CMIN=2.00–5.00; p<0.05). To assess the differences between corresponding elements of the data to the hypothesized model, a root mean square error of approximation was evaluated between 0.00 and 0.10, along with its 90% confidence interval. The comparative fit index received examination at greater than or equal to 0.95. To assess the least number of variables accounting for the most amount of variance between the data and the hypothesized model, the parsimony goodness of fit index was assessed at greater than or equal to 0.10. Cronbach’s alpha was checked against a minimum of α>0.70 to indicate a reliable measure27. Along with this established criteria, model complexity and theoretical considerations were accounted for based on the suggestion of Marsh et al28, who cautioned against strict cut-offs for fit indices.
 Figure 1: Final model of the Rural Active Living Perceived Environmental Support Scale.
Final model and fit: Results from the confirmatory factor analysis showed an adequate fit between the hypothesized model and the data. Items in the final model were kept if the item-to-factor loadings were ≥0.40 (Table 1). Analyses produced a non-significant (p<0.05), acceptable χ2 goodness of fit index (3.56) with two degrees of freedom (CMIN/df=1.78). The comparative fit index (0.96) and parsimony goodness of fit index (0.46) were acceptable. The root mean square error of approximation (0.08) and its 90% confidence interval (0.02–0.13) were also acceptable. These overall findings, combined with a logical interpretation of the item content as compared to the underlying factors, led to the final determination that the hypothesized model fit the data well and no alternative model was tested. Internal consistencies for the RALPESS are presented in Table 1. Cronbach’s alpha for the full measure (α=0.96) and the seven subscales of IA (α=0.93), OA (α=0.80), TCC (α=0.82), TCR (α=0.83), SCH (α=0.87), CHU (α=0.94), and AAH (α=0.86) were acceptable and exceeded the 0.70 criterion.
Discussion
This pilot study produced confirmatory evidence that the RALPESS can be used to measure perceived environmental supports of PA within RAI populations located in the USA. Analyses supported the construct validity of the measure as presented by a 33-item, seven-factor solution. These findings are significant because of not only the relative lack of research on PA in RAI populations, but also a difference in perceived environmental supports for PA in rural areas when compared to urban areas. Continued validation of this scale, particularly in diverse international communities, will support further investigation into this important public health issue of rural physical inactivity. It is also suggested that future researchers assess the predictive and nomological validity, as well as concurrent use of the RALPESS with the Rural Active Living Assessment tools29, to inform geographically appropriate interventions towards the promotion of PA worldwide. Finally, the authors recommend consideration of the degree to which financial barriers may affect access to some resources, which may be ‘identified’ as being within the environment, but that are – in reality – difficult to utilize.
Limitations
Despite the valuable contributions of this research, the generalizability of findings should be considered given some limitations. Convenience sampling methods were used to recruit participants specific to the research aims, for which physical limitations are noted to be disproportionally high among RAI populations30, and likely impacted PA engagement. Most participants in the sample were overweight/obese adult females who had at least a high school/General Education Diploma education and were employed. Although adequate for this study31, some researchers prefer larger samples for confirmatory factor analysis and note that arranging like items together on instrumentation could lead to the assertion that the construct validity of the measure is part and parcel of the assessment structure. Lastly, self-report data and BMI increasingly have been shown to be less effective32 and accurate metrics of health.


