Introduction
Recent surveys estimate that approximately 14% of Canadians do not have a regular doctor1-3. In Canada, 20.3% of the total population live in rural areas, however, only 9.3% of all physicians in Canada work in rural areas4. Not surprisingly, a larger proportion of rural residents than urban residents do not have a regular physician. For example, in Newfoundland and Labrador, Canada's easternmost province, almost three-quarters of the residents who did not have a regular doctor lived in rural communities5.
In addition to lacking physicians, many rural communities have a high rate of physician turnover; an estimated 18 to 30% of rural physicians in Canada leave their jobs each year6-8. A survey of physicians in British Columbia found that 35 of 195 (18%) rural/remote physicians indicated they were planning to relocate to an urban setting7. In Saskatchewan, 52% of rural physicians left their communities over a 5 year period, from fiscal 1992/1993 to 1996/19979. Similarly, a survey of US physicians reported that 27.1% intended to leave their practices in the next 2 years9.
A number of factors contribute to high physician turnover rates in Newfoundland and Labrador. Many physicians leave for higher pay in other parts of Canada and the USA. The average retention rate among newly licensed family physicians is 25 months10. Moreover, provisional licensing policies allow international medical graduates (IMG) to work in the province while completing requirements for full licensure. International medical graduates make up a large proportion (44.5%) of family physicians in the province4, and provisionally licensed IMG work an average of 22 months before leaving the province, 7 months after qualifying for a full license.
A number of studies have compared individuals with and without a regular physician in a publicly insured healthcare system1,5,11-13. However, we were unable to find studies that examined the impact of a changing doctor. Using data from two population-based telephone surveys, we compared socio-demographic status, health status, lifestyle, preventative care, and health system access correlates among rural residents who had a regular doctor, those whose regular doctor frequently changed and those who did not have a regular doctor. We hypothesized that rural residents whose doctor changed would have poorer health status, lifestyles, preventative care, and perceptions of the health system than residents with a regular doctor; but better health status, lifestyles, preventative care, and perceptions of the health system than residents who did not have a regular doctor.
Methods
With the approval of the Human Investigations Committee (Memorial University of Newfoundland) we examined data from the 1995 Newfoundland Panel on Health and Medical Care and the 2001 Adult Health Survey14,15. Both surveys gathered data on the self-assessed health status of adult residents in Newfoundland using many of the same questions, thus allowing for comparisons to be made between the samples on a number of variables. Both telephone surveys randomly sampled house households on the island of Newfoundland and selected adults 19 years and older to interview. The 1995 survey interviewed all adults from selected households, while the 2001 survey randomly selected one individual from each household to interview. Both surveys included the non-institutionalized population who both owned a telephone and were covered by the provincial health insurance plan. They excluded members of the armed forces, the Royal Canadian Mounted Police, students with parental homes elsewhere in the province, as well as foreign and out-of-province students.
Both surveys included identical questions to determine whether respondents had a regular doctor, to which respondents could answer 'yes', 'no' or 'visit same healthcare facility but doctor changes'. We considered socio-demographic status, health status, lifestyle, preventative care, and health system variables. Socio-demographic variables were: age, sex, marital status, income, employment, and education level. Marital status was coded into partnered (married or common law) or not partnered (single, separated, divorced, or widowed). Health-status variables included self-reported health status, number of chronic conditions, permanent disability, the number of restrictions to activities of daily living (ADL). Lifestyle variables were lifestyle exercise and healthy weight. Healthy weight was based on body mass index (BMI) calculated from self-reported height and weight. Unhealthy weight included BMI under 20 and over 25. Less than 1% of the sample was underweight. Preventative care variables were Papanicolaou (Pap) test and annual blood pressure check, while health system variables were satisfaction with the healthcare system and unmet need.
The 1995 and 2001 data were coded into identical response categories; however, this was not possible for all variables because the survey questions and/or response categories were different. For example, we were unable to re-code income into identical categories. Likewise, in 1995, the survey asked women whether they had a Pap smear in the previous 2 years, while the 2001 survey asked about Pap smears in the previous 3 years. Although education, health status and health system satisfaction were coded in similar categories, the original questions were dissimilar. For example, the 1995 health status and health system question used a four-point Likert scale, while the 2001 survey used a five-point Likert scale. Sensitivity analyses were conducted to ensure that re-coding of the data, as well as missing values, did not change the overall results.
We examined residents of rural communities. "Rural" was defined as a community with 10 000 or less population. Using SPSS v 12.0, frequencies were used to describe the 1995 and 2001 samples. For each year, χ2 tests were used to compare individuals who had a regular doctor and those whose doctors changed, and to compare individuals without a regular doctor and those whose doctors changed for each of the socio-demographic, health status, health behaviour, preventative care and health system variables. Multiple logistic regression was used to assess the impact of having a changing doctor on each of the health status, health behaviour, preventative care and health-system variables. The regressions controlled for socio-demographic variables. The independent, or comparator, variable of interest in the regressions was 'had regular physician'; specifically, those whose doctor changed and those who did not have a regular doctor were compared with residents with a regular doctor.
Results
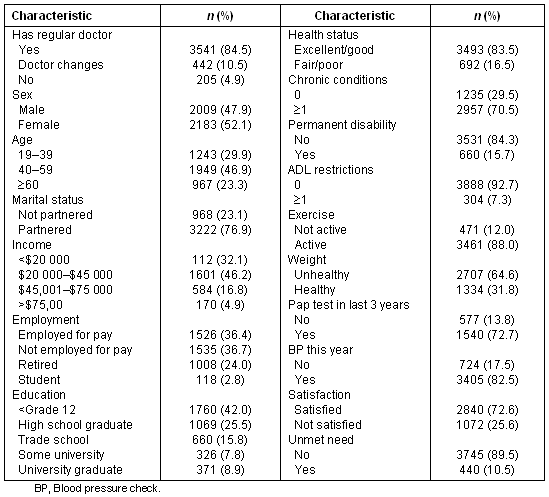
We studied 6156 and 4192 rural residents in our 1995 and 2001 samples, respectively. Tables 1 and 2 present the characteristics of the samples. A larger proportion of rural residents had a regular family doctor in 2001 (84.5%) than in 1995 (78.1%). The proportion of residents without a family doctor decreased from 8.4% in 1995 to 4.9% in 2001, and those whose doctors changed decreased from 13.6% in 1995 to 10.5% in 2001.
Table 1: Characteristics of 1995 sample
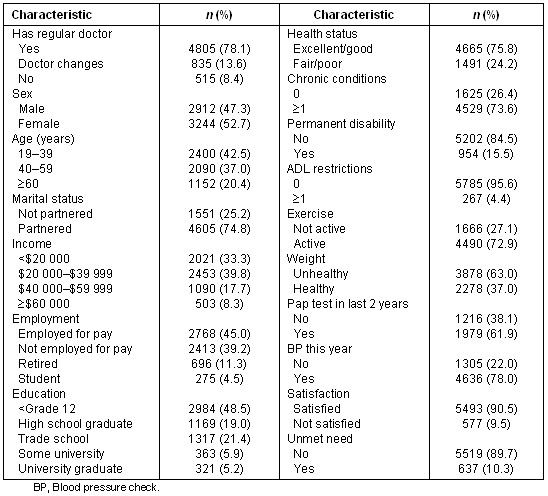
Table 2: Characteristics of 2001 sample
In 1995, compared to those with a regular doctor, a significantly larger proportion of respondents whose doctor changed were male, under 40 years of age, not partnered, had income between $20 000 and $39 999, and were employed for pay (Table 3). A larger proportion of respondents whose doctor changed had no chronic conditions, no permanent disability, no ADL restrictions, were active, had not had their blood pressure checked, and were dissatisfied with health care compared with those with a regular doctor. There was no significant differences in terms of education, health status and BMI, having a Pap test or having unmet need. In 2001, there were no statistically significant differences between those who had a regular doctor and those who doctor changed (Table 4).
In 1995, compared to those without a regular doctor, a significantly larger proportion of respondents whose doctor changed were female, were in fair/poor health and had one or more chronic conditions (Table 3). There were no significant differences in the other socio-demographic status, health status, healthy behaviour, preventative care or health system variables. In 2001, there were a number of significant differences between these two groups (Table 4). A significantly larger proportion of those whose doctors changed were female, were over 60 years of age, were partnered, retired, had fair/poor health, had one or more chronic conditions, had a permanent disability and ADL restriction, than those without a regular doctor. There were no significant differences in income, employment, education, BMI, or any of the preventative care or health system variables.
Table 3: Comparison of respondents whose doctors change to those with regular doctors and no doctors, 1995
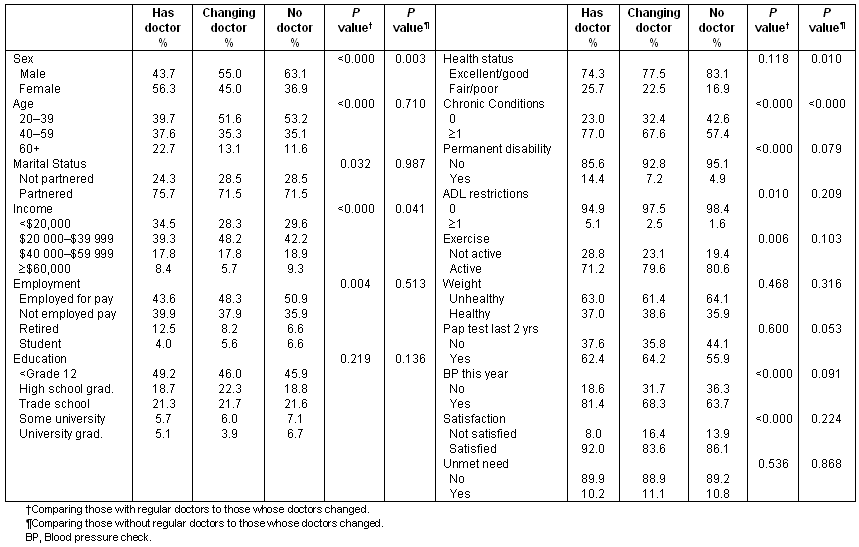
Table 4: Comparison of respondents whose doctors change to those with regular doctors and no doctors, 2001
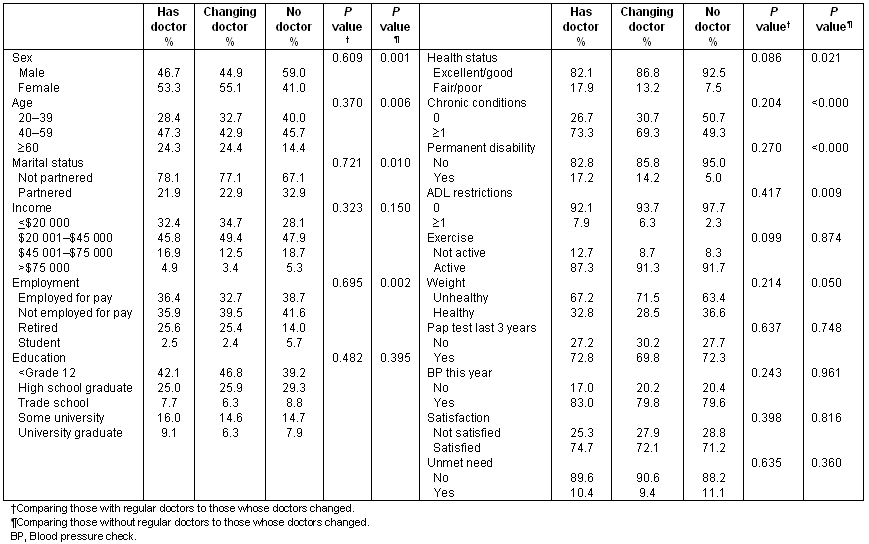
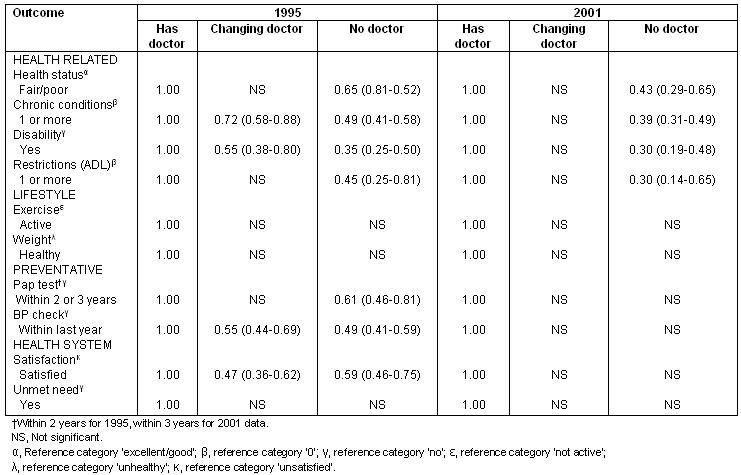
Table 5 describes the results of the regression analyses. In each regression, we controlled for socio-demographic variables. In 1995, respondents whose doctors changed shared characteristics with both those with a regular doctor and those without a regular doctor. For example, those whose doctors changed were not significantly different from those who had a regular doctor in terms of health status, ADL restrictions, or having a Pap test. Like those without a regular doctor, respondents whose doctors changed were less likely to have one or more chronic conditions or a permanent disability, have had their blood pressure checked in the last year or be satisfied with the healthcare system. In 2001, those whose doctors changed were like respondents with a regular physician; there were no significant differences between these groups in any of the regression models. Those who did not have a regular physician were 'healthier'; that is, they were less likely to have poor health, chronic conditions, a permanent disability, or any ADL restriction. Having a regular physician was also no longer related to any of the preventative care or health system variables. In both 1995 and 2001, having a regular doctor was not related to any of the healthy behaviour variables or having unmet need.
Table 5: Summary of multiple logistic regression analyses
Discussion
The proportion of rural residents without a regular doctor or whose doctor frequently changed, decreased between 1995 and 2001. During this time, the number of family physicians, including GPs, in the province was stable. There were 606 family physicians in 1995, and 599 family physicians in 2001. However, the population : family physician ratio decreased from 940 in 1995 to 845 in 2001, indicating that the improvement in access to physician resulted from a decrease in the population, rather than an increase in physician supply4,16. In 1995, residents whose doctors changed shared characteristics with both those with regular doctors and those without regular doctors, suggesting that residents whose doctors changed represented an intermediate group. By 2001, however, those whose doctors changed were distinct from those without a regular doctor, who, based on regression results for the health status variables, were healthier than either those with regular doctors or those whose doctors changes. These findings suggest that residents who most need care are more likely to seek it out, and that the disparities between those who had a regular doctor and those whose doctor changed diminished.
As access to doctors improved, rural residents without a regular doctor appear more like urban residents without regular doctors. A previous study found that urban residents in Newfoundland and Labrador who did not have a regular doctor were younger adults, male, in better health, and for whom not having a regular doctor may have been a matter of personal choice rather than limited access5.
Health behaviours, specifically being physically active and maintaining a healthy weight, were not related to having a regular physician in either 1995 or 2001. Newfoundland and Labrador has the highest proportion of overweight and obese residents among Canadian provinces, and among the highest incidence of obesity related chronic illnesses such as diabetes and cardiovascular disease17. This study suggests that access to a regular physician in itself does not lead to improved lifestyle, but rather community-based, multidisciplinary initiatives are needed to address this local health priority18.
Similarly to other studies in Canada that examined having a regular source of care12,13, residents without a regular doctor in 1995 were less likely to have their blood pressure checked or to have had a Pap smear. However, in 2001, there was no relationship between having a regular doctor and receiving preventative care. We believe that this finding is likely to be a result of greater access to these services from non-physician providers. For example, by 2001, as part of an organized cervical screening program, public and community health nurses were providing Pap tests. Between 1995 and 2001, a greater number of pharmacies were offering automated blood pressure testing. The overall increase in both these preventive services is likely to have resulted from increased access to these services in general, particularly since the surveys did not specifically ask whether these services were provided by a physician.
Having a regular physician was not related to having unmet need. This is in part because in Canada's publicly insured healthcare system, residents may access health care regardless of whether they have a regular provider. Patients are also able to seek care from other sources, such as emergency departments, if their physician is not available.
Despite the improved access to regular doctors, which is suggested by the increased proportion of rural residents with a regular doctor, dissatisfaction with the healthcare system rose from 9.5% in 1995 to 25.6% in 2001. In addition in 2001, unlike 1995, satisfaction was no longer related to having a regular physician. Recent reports suggest that dissatisfaction with the Canadian healthcare system is related in part to access issues, including access to a regular physician19-21. These findings suggest that more research is needed to understand the complex relationship between access and public satisfaction with the healthcare system.
Limitations
This study used secondary data from two population-based telephone surveys. Although the survey methods share many similarities, there are a number of notable differences. The questions and response categories for the independent variable, having a regular doctor, was identical in both surveys. However, there were slight differences in either the wording of the questions or the response categories in 14 of the 23 variables considered in the study. Moreover, the 1995 surveys included all members of a household in its sample, while the 2001 survey included only one randomly selected adult in its sample, specifically the adult who last had a birthday. The design effect of the 1995 survey is small15 and unlikely to account for the findings. Moreover, our results are consistent with other recent, national studies which found that more Newfoundlanders have a regular doctor3,19. It is unlikely, therefore, that the differences we report between 1995 and 2001 are solely the result of differences in sampling strategies.
Conclusion
Access to a regular doctor in rural Newfoundland has improved. Disparities, particularly in health status, between those whose doctors changed and those with regular doctors decreased; by 2001, the characteristics of those whose doctors changed were similar to those who had a regular doctor. In 2001, rural residents without regular doctors were healthier than residents with a regular doctor or whose doctors changed, suggesting that the residents who seek a regular source of care are those most in need.
Acknowledgements
The authors would like acknowledge that Maria Mathews holds a New Investigator Award from the Canadian Institutes of Health Research (Regional Partnership Program). Amanda Park held a Masters fellowship from the Canadian Institutes of Health Research /Canadian Health Services Research Foundation funded Atlantic Regional Training Centre. The Newfoundland Panel on Health and Medical Care was funded by the National Health Research Development Program and the Newfoundland and Labrador Department of Health and Community Services. The 2001 Adult Health Survey was funded by Newfoundland and Labrador Statistics Agency.
References
1. Talbot Y, Fuller-Thomson E, Tudiver F, Habib Y, McIsaac WJ. Canadians without regular medical doctors, who are they? Canadian Family Physician 2001; 46: 58-64.
2. Sanmartin C, Houle C, Berthelot JM, White K. Access to health care services in Canada, 2001. Ottawa, ON: Statistics Canada, 2001; 1-29.
3. Statistics Canada. Regular medical doctor by sex, household population ages 12 and over, Canada, provinces, territories, health regions and per groups, 2005. Health Indicators. Online (2005). Available: http://www.statcan.ca/english/freepub/82-221-XIE/2006001/tables/t010b.pdf (Accessed October 18, 2006).
4. Canadian Institute for Health Information. Supply, distribution and migration of Canadian physicians 2004. Ottawa: Canadian Institutes for Health Information, 2005.
5. Mathews M, Edwards AC. Having a regular physician: urban-rural differences in Newfoundland. Canadian Journal of Rural Medicine 2004; 9: 166-172.
6. Hutten-Czapski P. Family doctors where they are needed, integration, not money, required. Canadian Family Physician 2001; 47: 685-686.
7. Yang J. Potential urban-to-rural physician migration: the limited role of financial incentives. Canadian Journal of Rural Medicine 2003; 8: 101-106.
8. Florizone A. SMA (Saskatchewan Medical Association) survey of rural physicians. Canadian Journal of Rural Medicine 1997; 2: 180-186.
9. Pathman DE, Konrad TR, Rebekkah D, Koch G. Retention of primary care physicians in rural health professional shortage areas. American Journal of Public Health 2004; 94: 1723-1729.
10. Mathews M, Edwards AC, Rourke JTB. Provisional licensing and retention of family physicians in Newfoundland and Labrador. St Johns: Division of Community Health and Humanities, Memorial University of Newfoundland, 2007.
11. Menec VH, Roos NP, Black C, Bogdanovic B. Characteristics of patients with a regular source of care. Canadian Journal of Public Health 2001; 92: 299-303.
12. Menec VH, Sirski M, Attawar D. Does continuity of care matter in a universally insured population? Health Services Research 2005; 40: 389-400.
13. McIsaac WJ, Fuller-Thomson E, Talbot Y. Does having regular care by a family physician improve preventive care? Canadian Family Physician 2001; 47: 70-76.
14. Segovia J, Edwards AC, Bartlett RF. Newfoundland Panel on Health and Medical Care - Adult Health Survey. Canadian Journal of Public Health 1999; 90: 412-416.
15. Newfoundland & Labrador Statistics Agency. Newfoundland Adult & Community Health Survey. St Johns: Government of Newfoundland and Labrador, 2001.
16. Canadian Institute for Health Information. Supply, distribution and migration of Canadian physicians 1996. Ottawa: Canadian Institutes for Health Information, 1997.
17. Statistics Canada. Canadian Community Health Survey: obesity among children and adults. The Daily, 6 July 2006. (Online) 2006. Available at:
http://www.statcan.ca/Daily/English/050706/d050706a.htm (Accessed October 17 2006).
18. Department of Health and Community Services. Healthier together - a strategic health plan for Newfoundland and Labrador. St Johns: Government of Newfoundland and Labrador, 2002.
19. Sanmartin C, Houle C, Berthelot JM, White K. Access to health care services in Canada, 2001. Ottawa, ON: Statistics Canada 2001; 1-29.
20. Consensus Research Group. Perceptions of healthcare - a survey of patient organizations' concerns. New York: Consensus Research Group, 2006.
21. Decima Research. How many wait too long for health care? (Online) 2006. Available: http://www.decima.com/en/pdf/news_releases/060825E.pdf (Accessed 12 September 2006).

