There have been several recent attempts to look at health disparities among Canadians, including Francophone residents living in minority socio-linguistics situations1. Previous research suggests that Francophones in Ontario experience poorer health than the general population2-4. For some Francophones, lack of access to French language medical services may contribute to poorer health status5, but the strength of this relationship is unknown. With over 12 million residents, Ontario accounts for nearly 40% of the Canadian population and has the largest Francophone population living outside of Quebec, although Francophones make up only 4.2% of Ontario's population6. A recent survey among Francophone policy-makers, health professionals, researchers and residents of Ontario identified French language health services research as the main priority for future inquiry7. The existence of adverse effects of language barriers on patient access has been well documented in Canada and abroad; effects include possible delays in seeking care, increased risk of adverse outcomes and reactions, reduced comprehension of physician instruction, reduced compliance with physician instruction, reduced patient satisfaction, and potentially less adequate management of chronic conditions8-11. However, research on the availability and use of French-language medical services in Ontario is relatively sparse, and to date has relied primarily on patient perceptions.
For instance, according to a report published by the Fédération des Communautés Francophones et Acadienne du Canada only 12% of Francophones in Ontario claimed to always have access to hospital services in French, while 74% of the more than half million Franco-Ontarians said they 'have either no access at all or rarely access to hospital services in French'12. Furthermore, an analysis of the Survey on the Vitality of Official-Language Minorities found that while 75% of Francophones in Ontario find it important to receive services in French, only 33% report having spoken to their family physician (FP) in French in the last 12 months13. There would appear to be only one study that sought to identify the prevalence of French-speaking primary medical care providers. Gauthier, Timony and Wenghofer recently reported that physician-to-population ratios appear quite favorable for Francophones, with one French-speaking physician for every 138 Francophones, compared to the provincial average of one physician for every 530 residents in Ontario14. However, the researchers concluded that perceptions of inadequate availability of French-language services across the province of Ontario are likely due to a mal-distribution of such services. Ratios of French-speaking physicians to Francophones were clearly favorable in southern and urban areas of the province (both areas are more heavily populated and developed), leaving rural and northern areas underserviced, which is important given the predominance of Francophones in rural northern regions.
It is estimated that 19% of Francophones live in rural Ontario15, while nearly 25% live in northern Ontario16. The health of rural and northern Ontarians is worse in many respects when compared to urban and southern residents17-19. Thus, the ill effects of language barriers on access to and quality of health care, the geographic mal-distribution of French-speaking physicians in Ontario, and the fact that there is a greater percentage of Francophones older than 4516 and who may require more services in French, lead to potentially unfavorable synergistic interactions.
Gauthier and colleagues' initial examination of the distribution of French-speaking physicians suggested a lack of such physicians in rural and northern parts of the province, where many Francophone reside14. However, this comparison of broad geographic regions was not sensitive enough to determine whether physicians who can offer services in French have located their practice among French-speaking populations, many of whom reside in rural areas. The objective of the current study was twofold: first, to establish a degree of 'francophonie' in each individual community of Ontario based on the percentage of residents identifying French as a first official language spoken; second, to identify the number of French-speaking physicians within each of these communities. As a result, a clearer understanding of medical service provision for French-speaking residents in Ontario could be obtained.
Data and study population
In this study, a secondary data analysis was conducted using data from 22 688 Ontario-based FPs and specialists who filled out the 2007 College of Physicians and Surgeons of Ontario Annual Membership Renewal Survey. The survey, which reports a 98% response rate, is the registration process for licensure in Ontario. In the current study, only Ontario's 10 968 FPs certified by the College of Family Physicians of Canada, and uncertified general practitioners (GPs), are included in the analyses. According to Wenghofer, Timony and Pong20 the majority of specialists certified by the Royal College of Physicians and Surgeons of Canada are located in Ontario's southern urban communities. Specialists were not included in the analysis because their numbers would inflate results in southern urban communities, thus exaggerating the potential mal-distribution of physicians. These FP/GP data were compared to the population of Ontario using data from the 2006 census. Specifically, communities in which French-speaking physicians have located their primary practice were identified and categorized based on the proportion of the population who spoke French. These communities were further categorized based on their degree of rurality and their geographic location.
Language categorization
On the College of Physicians and Surgeons of Ontario Annual Survey, physicians list all languages in which they are competent enough to conduct practice. Physicians who self-identified as being competent in French were classified as French-speaking. Statistics Canada's first official language spoken, a variable derived by combining knowledge of Canada's two official languages (French and English), mother tongue and the language most often spoken at home, was used to determine the respondents' language21. In this study, Ontarians classified as Francophones represent those whose first official language spoken is solely French. All other Language categorizations, including 'English', 'English and French', 'English and other', and 'neither English nor French' were classified as 'English and other'. This more restrictive definition of a Francophone was chosen due to the greater likelihood that this group would both have a need for and a desire to receive medical services in French. A more detailed description of how the 'first official language spoken' is derived is available at the Statistics Canada website (http://www.statcan.gc.ca/concepts/definitions/language-langue05-eng.htm).
French community categorization
A 2010 Statistics Canada analysis of official-language minorities in Canada found that the majority (78%) of Ontario Francophones, as defined by their first official language spoken, live in census subdivisions (CSDs) where they account for less than 30% of the population in that community; and fewer than 40% of Francophones live in CSDs where they account for less than 10% of the population22. Canadian CSD boundaries often reflect Ontario's municipalities and are therefore reasonably equivalent to communities. Since 1986 Ontario has adopted the French Language Services Act, which guarantees Ontarians, living in designated areas, the rights to be served in French by government agencies23. For an area to receive such a designation, it must have a Francophone population of at least 5000 (in urban centres) or represent 10% of the total population (in rural areas).
Given the distribution of Francophones reported by Corbeil and Lafrenière22, and considering the designation criteria for the French Language Services Act23, Ontario's CSDs were divided into three categories: strong French communities, with a Francophone population ≥25%; moderate French communities, with a Francophone population of 10-24%; and weak/no French communities, with a Francophone population <10%.
Geographic location categorization
The physicians' primary practice postal codes were used to define their geographic location. Postal codes beginning with P were classified as northern, while all remaining postal codes, (those beginning with a K, L, M or N) were classified as southern. The same approach was used to divide the Ontario population by geographic location. This definition of north and south, although not universally accepted, has been used in prior health research14,20 and the boundary closely resembles that between the northern and southern local health integration networks24 used by the Government of Ontario and applied in the Rural and Northern Health Framework25. In this study, physicians' primary practice postal codes were linked to CSDs employing Statistics Canada's Postal Code Conversion Files.
Community size categorization
While no universally accepted definitions of rural or urban have been established in the literature, many rural health researchers14,17,20,26-28 have adopted Statistics Canada's definitions of census metropolitan area, census agglomeration and metropolitan influenced zones. This approach defines census metropolitan areas (CSDs with a population of at least 100 000) and census agglomerations (CSDs with population of at least 10 000) as urban whereas metropolitan influenced zones (all other CSDs) are considered rural. In this study, CSDs were classified as either urban (when located in a census metropolitan area or a census agglomeration) or rural (when located in any metropolitan influenced zones).
Data analysis
The College of Physicians and Surgeons of Ontario Annual Survey data set represents all physicians with a primary practice address in Ontario, making the use of inferential statistics unnecessary. Physicians were categorized by language of competence and their primary practice addresses were linked to CSDs using postal codes. All of Ontario's CSDs were classified for degree of francophonie, rurality and geographic location. The number of physicians and population size of each CSD was used to create the following ratios: French-speaking FP/GPs per 1000 Francophones and total number of FP/GPs per 1000 Ontarians. Results presented here are a comparison of these ratios.
Ethics and funding
Funding for this study was provided by the Consortium National de Formation en Santé (CNFS) and research ethics approval was granted by the Laurentian University Research Ethics Board; ethics approval number 2012-05-02.
Ontario's Francophone communities
Ontario had 527 communities (CSDs)in 2006: 141 (27%) were urban and 386 (73%) were rural (Table 1). Northern Ontario had 248 communities.
Approximately 9% of Ontario's communities were classified as strong French communities while 6% were classified as moderate French communities. Approximately 76-79% of the strong French and moderate French communities were located in northern and rural Ontario. On average, 41% of the population of strong French communities and 16% of the population of moderate French communities were considered Francophone. In Figure 1, a map of Ontario's communities clearly demonstrates that the strong and moderate French communities were primarily located in north-eastern Ontario.
The vast majority (85%) of communities in Ontario were considered to be weak/no French communities (n=446). These communities were primarily located in southern (59%) and rural (73%) parts of the province and had an average French population of 2%. One out of every four weak/no French communities had a French population of 0%.
Table 1: Ontario communities by degree of 'francophonie'
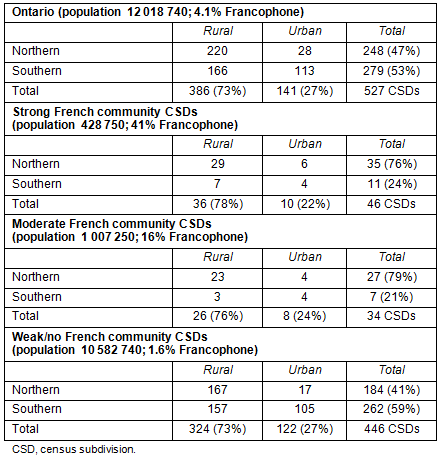
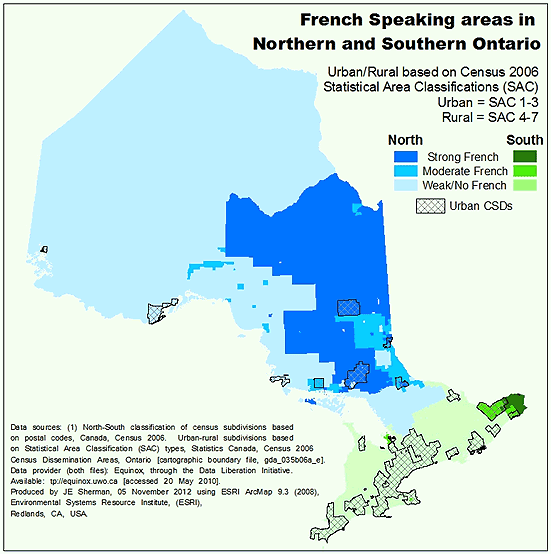
Figure 1: Map of Ontario's census subdivisions by degree of francophonie.
Ontario family physicians and general practitioners within French communities
Among the 10 968 Ontario-based FP/GPs, 1674 (15%) identified French as a language in which they are competent enough to conduct practice. Approximately 55% of all FP/GPs in strong French communities, and 43% of FP/GPs in moderate French communities report that they are competent enough to provide services in French, compared to only 10% of FP/GPs in weak/no French communities (Table 2). However, most French-speaking FP/GPs (55%) in Ontario were located in weak/no French communities, while only 14% were located in strong French communities (Table 2).
This mal-distribution is further exemplified when examining physician-to-population ratios (Fig2). Overall, the number of FP/GPs per 1000 Ontarians ranged from 0.9 to 1.2. Interestingly, as the degree of francophonie decreased, ratios of French-speaking FP/GPs to Francophones increased: by a factor of almost three for moderate French communities and by four for weak/no French communities compared to strong French communities.
On average, ratios remained relatively consistent when comparing total FP/GPs to the population in each community category, ranging from 0.7 to 0.8 FP/GPs per 1000 Ontarians in rural Ontario and from 0.9 to 1.3 in urban Ontario (Table 3). French-speaking FP/GPs to 1000 Francophone ratios were variable, with the smallest ratios identified in the strong French communities (0.9 French-speaking FP/GPs per 1000 Francophones in rural Ontario and 1.6 in urban Ontario). The largest ratios were in weak/no French communities (5.4 French-speaking FP/GPs per 1000 Francophones in rural Ontario and 5.6 in urban Ontario). Compared to rural CSDs, urban CSDs had consistently larger ratios in all community categories. In fact, urban weak/no French communities had twice the population but 13 times the number of French-speaking FP/GPs than rural strong French communities.
Much like the rural and urban comparison, an examination of northern and southern communities revealed that average provincial ratios remained relatively consistent, ranging from 1.0 to 1.2 FP/GPs per 1000 Ontarians in northern Ontario and 0.9 to 1.2 in southern Ontario (Table 4). Ratios of French-speaking FP/GPs to 1000 Francophones were much less consistent. Both in the north and in the south, weak/no French communities had the largest ratios of French-speaking FP/GPs to 1000 Francophones (5.2 in the north and 5.6 in the south), whereas strong French communities had the smallest ratios (1.1 in the north and 1.7 in the south). Also, regardless of the Francophone community classification, southern communities consistently had larger ratios.
When examining the interaction of geographic location and community size (data not shown), French-speaking FP/GPs to 1000 Francophone ratios are smallest in strong French communities of the rural south (0.8) and rural north (0.9) and largest in weak/no French communities of the urban south (5.6) and rural north (5.9).
Table 2: Number of Ontario family practitioners and general practitioners within French communities
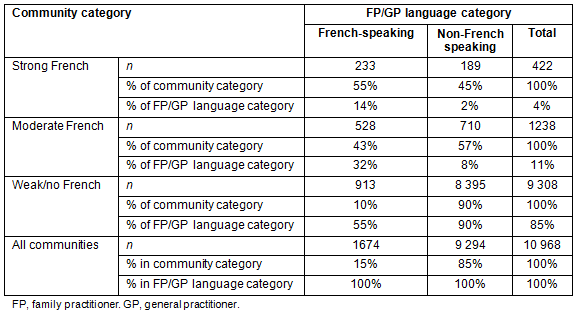
Table 3: Geographic distribution of French-speaking family practitioners and general practitioners in Ontario by urban/rural communities

Table 4: Geographic distribution of French-speaking family practitioners and general practitioners in Ontario by north/south communities

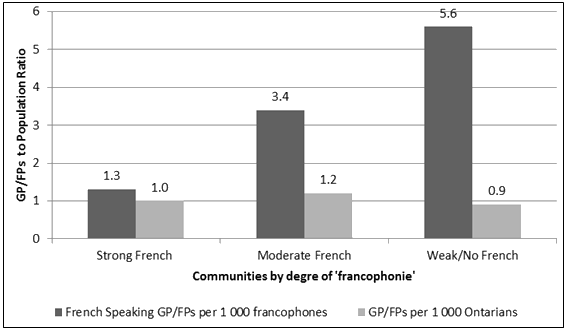
Figure 2: FP/GP-to-population ratios within French communities. FP, family practitioner. GP, general practitioner.
Discussion
There are nearly as many French-speaking FP/GPs as non-French speaking FP/GPs in the strong and moderate French communities. This would suggest that Francophones living in these communities are likely to be served in French, which is in contrast to what has been previously reported by others8. However, physician-to-population ratios in these communities range between 1.0 and 1.2, which, according to Chan and Benjamin29, is nevertheless indicative of a physician shortage. Although an equal distribution of French-speaking and non-French-speaking physicians in strong French communities seems favorable, these strong French communities are underserved - 50% of too few remains too few. It is interesting to note that more than half of Ontario's French-speaking FP/GPs have located their practices in communities virtually uninhabited by Francophones, and may not be serving a French population at all. Across the province of Ontario, as the number of Francophones increases in a community, the ratio of French-speaking physicians to Francophones decreases.
In addition, Francophone ratios are consistently larger in all community categories in southern Ontario. Unlike the south, northern Ontario has a much smaller population density: northern Ontario covers nearly 90% of the province's land mass, but houses only 6% of the population30. As a result, not only do Francophones have less access to French language services, but, like all northerners, they must also travel greater distances to receive such services. The disparity is further exemplified considering that ratios are consistently smaller in rural areas of Ontario. Non-Francophone urban communities in the south have the highest availability of French-speaking FP/GPs whereas Francophone rural communities in the north have the lowest availability.
The fact that French FP/GP ratios are consistently equal to or more favorable than ratios for the general population, regardless of a community's Francophone classification, its geographic location or its size, cannot be ignored. These ratios suggest that Francophones should have adequate or even better access to French-speaking physicians, which is not what is found in the literature12,13. The divergence between the potential availability of French physicians and the actual utilization of their services has previously been discussed14 but warrants further attention. First, French-speaking FP/GPs in this study have been defined using a self-assessed measure of competence. Conclusions based on this definition need to be made with caution as it is possible that physicians have overestimated their level of competence with the French language, which in turn inflates their counts. Second, the definition of a Francophone used here intentionally excludes Ontarians whose first official language spoken is both French and English, potentially underestimating the number of people who are actually seeking French-language services. The interaction of overestimating the number of FP/GPs who can offer services in French and underestimating the number of Francophones may be artificially inflating the ratios of French-speaking FP/GPs to Francophones. Furthermore, self-reported ability to conduct practice in French does not mean that these physicians are actually practicing in French or serving a French population. Mistaking potential availability with actual service provision is possible when interpreting these results. The ratios discussed here represent a hypothetical situation where French-speaking FP/GPs exclusively treat Francophones and do not take into account that these physicians may also treat non-French speaking persons. All told, the actual number of Francophones seen by these physicians is potentially much lower than the ratios suggest. Regardless of the potential availability of French-speaking physicians, the literature shows that Ontario's Francophones continue to be underserved, which can be attributed in part to a mal-distribution of French-speaking physicians who are predominantly located in non-Francophone communities of the urban south.
These findings illustrate a paradox: the high potential availability of French language medical services for the population who could benefit from such services and the relatively poorer health of that population2-4. In addition, this research has uncovered the potential for a severe misalignment between the need for services in French and the availability of such services, particularly in rural areas. Communities with a French-speaking population of less than 10%, which is the minimum required to be considered a designated area under the Ontario French Language Services Act31, had greater potential opportunities to receive French language medical services than communities with a greater percentage of Francophones.
Gauthier and colleagues initially identified a severe mal-distribution of medical services in the province, with higher ratios in southern and urban Ontario14. The purpose of the present study was to more closely examine the distribution of French-speaking family physicians and general practitioners at the level of the community in Ontario. Communities that are least likely to need French-language medical services have more French-speaking FP/GPs, and communities with the greatest need seem to be left underserved. Furthermore, and consistent with Gauthier and colleagues' conclusions at the regional level, the French-speaking FP/GP to Francophone population ratios are considerably lower in northern and rural communities.
The present study has identified a gap between the potential and the perceived availability of French-language services. Furthermore, the relatively high ratios of French-speaking FP/GPs discussed here suggest that improving the supply of French-language services may not be as simple as increasing the number of physicians who can practice in French; rather, it requires greater efforts to ensure that these physicians locate their practice near French populations and actively provide services in French. Additional work is needed to understand the disconnection between this high potential availability of French-language medical services and the poor health status of Francophones. Future research will examine characteristics of French-speaking physicians who have located their practice in communities largely occupied by a French-speaking population. The health of Francophones, particularly those residing in rural and northern locations of the province of Ontario, is currently at risk. Narrowing the gap between the need for quality medical services and access to such services may result in a stronger, healthier Francophone population. Reducing the adverse effects of language barriers between a patient and their family physician is an important step in narrowing this gap. As Tumulty stated in 1970, 'What the scalpel is to the surgeon, words are to the clinician ... the conversation between doctor and patient is the heart of the practice of medicine'32.
References
1. Bouchard L, Desmeules M. Minorités de langue officielle du Canada: égales devant la santé? [in French] Quebec City, QC: Presses de l'Université du Québec, 2011.
2. Bouchard L, Roy JF, Lemyre L, Gilbert A. The health of Francophones minorities in Ontario: secondary analysis of the National Population Health Survey. Ottawa, ON: Population Health Institute and CIRCEM, University of Ottawa, 2002.
3. Bouchard L, Batal M, Imbeault P, Gagnon-Arpin I, Makandi E, Sedigh G. La santé des Francophones de l'Ontario: Un portrait régional tiré des Enquêtes sur la santé dans les collectivités canadiennes (ESCC) [in French]. (Online) 2012. Available: http://www.rrasfo.ca/images/docs/publications/2012/rapport_escc_ontario-final.pdf (Accessed 17 August 2012).
4. Picard L, Allaire G. Second report on the health of Francophones in Ontario. Sudbury, ON: REDSP - Ontario and Institut Franco-Ontarien, Laurentian University, 2005.
5. Canadian Institute for Health Information. Health care in Canada, 2011: a focus on seniors and aging. (Online) 2011. Available: https://secure.cihi.ca/free_products/HCIC_2011_seniors_report_en.pdf (Accessed 17 August 2012).
6. Statistics Canada. Population by mother tongue and age groups, 2006 counts, for Canada, provinces and territories. Available: https://www12.statcan.gc.ca/census-recensement/2006/dp-pd/hlt/97-555/T401-eng.cfm?Lang=E&T=401&GH=4&SC=1&S=99&O=A (Accessed 27 May 2013).
7. Chomienne M, Luyinga Kalay A, Farmanova E. Les priorités de recherche sur la santé des Francophones en Ontario [in French]. (Online) 2012. Available: http://www.rrasfo.ca/images/docs/Les%20priorites%20de%20recherche%20sur%20la%20sante%20des%20francophones%20de%20lOntario.pdf (Accessed 17 August 2012).
8. Bowen S. Language barriers in access to health care. Ottawa, ON: Health Canada, 2001.
9. Wilson E, Chen AH, Grumbach K, Wang F, Fernandez A. Effects of limited English proficiency and physician language on health care comprehension. Journal of General Internal Medicine 2005; 20(9): 800-806.
10. Flores G. The impact of medical interpreter services on the quality of health care: a systematic review. Medical Care Research and Review 2005; 62(3): 255-299.
11. Timmins CL. The impact of language barriers on the health care of Latinos in the United States: a review of the literature and guidelines for practice. Journal of Midwifery & Women's Health, 2002; 47(2); 80-96.
12. Fédération des Communautés Francophones et Acadienne du Canada (FCFA). Improving Access to French-Language Health Services. Ottawa, ON: Fédération des Communautés Francophones et Acadienne du Canada, 2001.
13. Gagon-Arpin I, Bouchard L. Les services de santé en Français en Ontario: offre, demande, utilisation [in French]. (Online) 2011 Available: http://www.rrasfo.ca/recherche/publications/Rapport%20EVMLO%20Ontario-final2.pdf (Accessed 17 August 2011).
14. Gauthier AP, Timony PE, Wenghofer E. Examining the prevalence and distribution of French speaking physicians in Ontario. Canadian Family Physician 2012; 58(12): 717-724.
15. Bouchard L, Gaboury I, Chomienne MH, Gagnon-Arpin I. Profil santé des communautés francophones minoritaires au Canada. (Online) 2009. Available: http://www.rrasfo.ca/images/docs/publications/2012/Profil%20sante%20des%20communautes%20francophones%20minoritaires.pdf (Accessed 2 December 2013).
16. Government of Ontario. Profile of Ontario's Francophone community. (Online) 2009. Available: http://www.ontario.ca/francophones/profile-ontarios-francophone-community-2009 (Accessed 7 August 2011).
17. DesMeules M, Pong R, Lagace C, Heng D, Manuel D, Pitblado R et al. How healthy are rural Canadians? An assessment of their health status and health determinants. Ottawa, ON: Canadian Institute for Health Information, 2006.
18. North West Local Health Integration Network. Population health profile: North West LHIN. (Online) 2011. Available: http://www.northwestlhin.on.ca/uploadedFiles/Home_Page/Report_and_Publications/Population%20Health%20Profile%20Oct%202011%20FINAL.pdf (Accessed 21 August 2012).
19. Bouchard LI, Gaboury MH, Chomienne I, Gagnon-Arpin I. Profile santé des communautés Francophones minoritaires au Canada. Ottawa, ON: Réseau de recherche interdisciplinaire sur la santé des Francophones en contexte minoritaire au Canada (RISF), University of Ottawa, 2009.
20. Wenghofer EF, Timony PE, Pong PW. A closer look at Ontario's northern and southern rural physician demographics. Rural and Remote Health 11: 1591. (Online) 2011. Available: www.rrh.org.au (Accessed 21 November 2013).
21. Statistics Canada. First official language spoken of person. (Online) Available: http://www.statcan.gc.ca/concepts/definitions/language-langue05-eng.htm (Accessed 5 February 2012).
22. Corbeil J-P, Lafrenière S. Portrait of official-language minorities in Canada: Francophones in Ontario. Ottawa, ON: Statistics Canada, Social and Aboriginal Statistics Division, 2010.
23. Office of Francophone Affairs. The French language Services Act: an overview. (Online) 2012. Available: http://www.ofa.gov.on.ca/en/flsa.html. (Accessed 15 October 2012).
24. Ontario Ministry of Health and Long-Term Care. Local health integration networks. Available: http://www.lhins.on.ca/aboutlhin.aspx?ekmensel=e2f22c9a_72_184_btnlink (Accessed 5 February 2012).
25. Ontario Ministry of Health and Long-Term Care. Rural and Northern Health Care Framework. (Online). Available: http://www.health.gov.on.ca/en/public/programs/ruralnorthern/default.aspx Accessed 5 February 2012.
26. Pampalon R, Martinez J, Hamel D. Does living in rural areas make a difference for health in Québec? Health & Place 2006; 12(4): 421-435.
27. Pong RW, DesMeules M, Lagacé C. Rural-urban disparities in health: how does Canada fare and how does Canada compare with Australia? Australian Journal of Rural Health 2009; 17(1): 58-64.
28. Hogenbirk JC, Pong RW, Lemieux SK. Impact of telephone triage on medical service use: implications for rural and remote areas. Journal of Agricultural Safety and Health 2005; 11(2): 229-237.
29. Chan, Benjamin TB. From perceived surplus to perceived shortage: what happened to Canada's physician workforce in the 1990s? (Online) 2002. Available: https://secure.cihi.ca/free_products/chanjun02.pdf (Accessed 16 May 2012).
30. Ministry of Northern Development and Mines. Northern Ontario overview. (Online) 2008. Available: http://www.nohp.ca/downloads/northern_on.pdf (Accessed 26 May 2009).
31. Government of Ontario (2009). French Language Services Act. (Online). Available: http://www.e-laws.gov.on.ca/html/statutes/english/elaws_statutes_90f32_e.htm. (Accessed 5 November 2012).
32. Tumulty P. What is a clinician and what does he do? New England Journal of Medicine 1970; 283: 20-24.

